The LNG market balance shifted dramatically from relative tightness in 2018 to oversupply in 2019. As last year drew to a close, there were some early signs of demand growth recovery. But 2020 has seen a renewed onslaught of oversupply, reinvigorating the trends established in 2019.
“2020 has seen a renewed onslaught of oversupply… higher LNG imports have started to breathe life back into the value of European regas capacity.”
A warm winter and large storage inventory overhang have flattened the TTF price curve. Forward prices are hovering around 10 €/MWh (3.30 $/mmbtu) out until Q4 2020. JKM prices have followed TTF lower, reflecting the overall global surplus.
The US gas market has also seen major price weakness in 2020. Henry Hub price declines reflect a growing domestic gas glut, driven particularly by associated gas volumes (e.g. gas prices in the Permian Basin have fallen below 0.50 $/mmbtu). Falling US gas prices are acting to pull down the US LNG shut in support levels for TTF & JKM prices.
In today’s article we look at 3 charts that dissect the structural shift in market balance that took place in 2019.
The supply picture
Supply is the more transparent part of the LNG market equation, given large projects and long lead times. Year on year changes in supply are dominated by new liquefaction projects coming online as illustrated in Chart 1.
Chart 1: 2019 vs 2018 global LNG supply volume changes
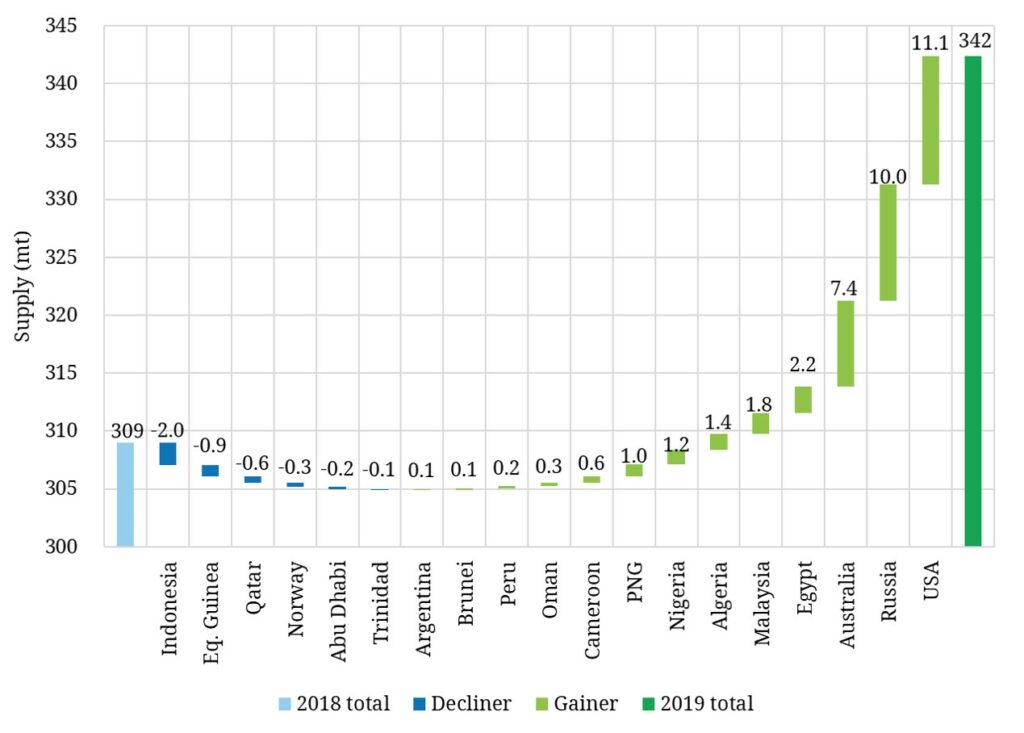
Source: Timera Energy, LNG Unlimited
Chart 1 shows some small volume declines from existing producers (e.g. Indonesia with depleting fields and a lack of upstream investment). But the chart is dominated by large new project volumes from Australia, the US and Russia. These are complimented by higher export volumes from some existing producers (e.g. Egypt, Malaysia & Algeria).
Investments in new supply were made in anticipation of robust Asian LNG demand growth. There was scant evidence of this in 2019, with weaker demand being the main driver of a shifting market balance.
Demand shift from Asia to Europe
The impact of rapid new supply growth shown in Chart 1, was compounded by outright declines in demand from the traditional pillars of Asian demand.
Japan, Korea and Taiwan (JKT), all saw declining demand in 2019 as shown in Chart 2. This was reinforced by weaker demand in South America (Argentina & Chile) and the Middle East.
Chart 2: 2019 vs 2019 global LNG demand volume changes
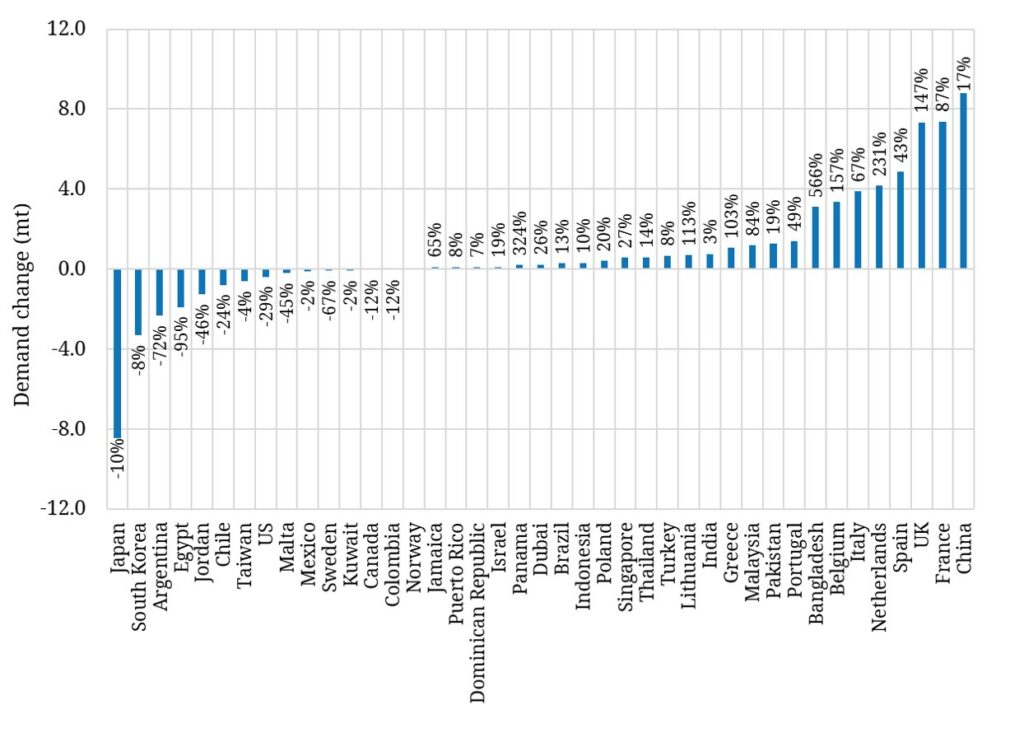
Source: Timera Energy, LNG Unlimited
The combination of rapid supply growth and weak demand saw large volumes of surplus LNG flow into Europe. The right hand side of Chart 2 is dominated by countries with regas terminal access: France, UK, Spain, Netherlands, Italy, Belgium & Portugal. It is not difficult to see why in 2019 European hub prices declined and CCGT load factors surged!
China was once again the country with highest demand growth by volume last year. But the 17% Chinese demand growth rate was less than half of its 2018 level.
Bangladesh was one genuine source of upside demand surprise, with almost 7 mtpa of demand growth. Growth dynamics going forward are supported by declining domestic production, gas-fired power investment and a new land based regas terminal (to compliment existing FSRU capacity).
Some other Asian markets also saw rising demand, helped in part by liberalising gas markets (e.g. Malaysia received its first Third Party Access cargo in 2019). But outside Bangladesh and a more measured increase in Pakistan, there was not much demand growth action from other emerging markets.
European regas utilisation surges
The natural consequence of rising European LNG imports is increasing regas terminal utilisation. This is illustrated in Chart 3 which shows aggregate European regas terminal send out volumes vs maximum send out potential.
Chart 3: Evolution of aggregate European regas terminal send out
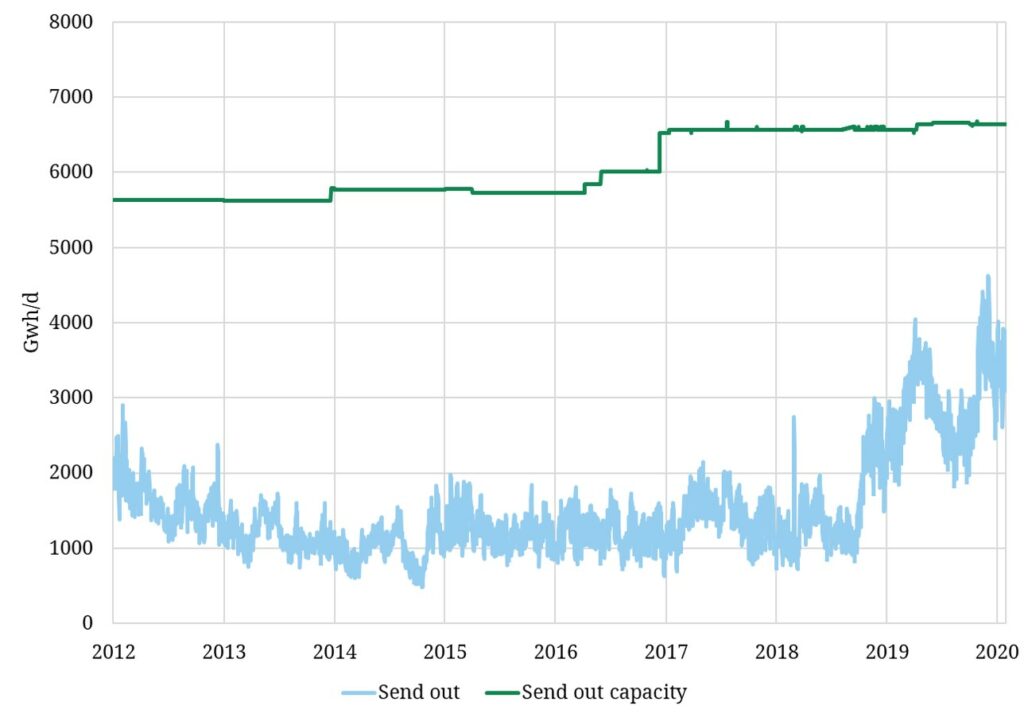
Source: Timera Energy, ALSI
Up until Q4 2018, Europe had seen many years of low regas terminal utilisation. But Chart 3 illustrates how a growing global surplus of LNG has seen average regas utilisation across Europe more than double in the last 18 months.
The chart appears to show what is still a healthy level of headroom between current send out and maximum potential. But this pan-European view of regas utilisation hides constraints that have emerged at individual terminals.
A number of terminals have seen very high or maximum capacity utilisation across 2019-20, for example Bilbao in Spain, Świnoujście in Poland, Adriatic (Cavarzere) and Zeebrugge. The impact of high import levels on NW European regas utilisation has been reinforced by a growing transhipment requirement for icebreakers bringing Russian LNG to market.
There are a handful of regas terminal development projects under way in Europe e.g. Wilhelmshaven in Germany and the Świnoujście expansion in Poland. But regas capacity growth looks to be fairly limited across the next 5 years. On the other hand there is a rapidly growing volume of divertible LNG supply that can flow into Europe during temporary or more structural periods of oversupply.
Higher LNG imports have started to breathe life back into the value of regas capacity across 2019-20. This looks set to continue through the 2020s with growing European import dependency and a structural tightening in regas capacity headroom.