Hedging underpins the risk management strategy of most energy portfolios. Hedging forward exposures acts to reduce the variability of portfolio returns and limit downside value loss.
“Hedging a portfolio and reducing downside risk, frees up balance sheet capacity…
and this risk capital can be productively invested to support value growth.”
Portfolio hedging is a natural activity for many LNG market participants e.g. commodity traders such as Gunvor, Vitol & Trafigura and European utilities such as RWE and Uniper.
However there are a surprising number of LNG players that currently do not hedge portfolio exposures. These include large producers as well as many National Oil Companies and large Asian buyers.
There are a variety of historical reasons as to why these companies have chosen not to hedge, which we set out below. But in a rapidly maturing LNG market, a number of these companies are reconsidering the benefits of portfolio hedging.
An effective hedging strategy is a powerful risk management tool. It also represents prudent management of scarce balance sheet and risk capital capacity. In this article we set out a practical LNG portfolio case study that demonstrates and quantifies those benefits.
The decision not to hedge
Despite the apparent benefits of LNG portfolio hedging, there are several reasons why many companies have chosen not to. We summarise these in table 1 below.
Table 1: Historical reasons not to hedge LNG portfolios
Shareholders have historically supported a strategic choice not to hedge for some producers and National Oil Companies. This decision has typically related more to retaining oil price exposure than LNG. But a lack of hedging for both oil and gas exposures has proved painful during recent bouts of market volatility (e.g. the 2016 and 2020 price slumps).
Many companies have wisely chosen not to hedge portfolios without the appropriate trading & risk management capability. But the costs and hurdles of establishing a basic commercial capability are relatively small compared to portfolio value downside protection from hedging.
The biggest practical constraints to LNG portfolio hedging have been limited forward market liquidity and the inherent physical & contractual complexity of some portfolio components. Liquidity is improving rapidly as the LNG market matures. Complexity remains a hurdle, but not one that on its own justifies a retreat from hedging.
Despite the apparent benefits, hedging is not an activity that should be embarked upon in a half-hearted manner. Hedging errors can magnify rather than reduce risk. Implementing a robust hedging strategy means directly tackling issues such as commercial capability and portfolio complexity.
The case study portfolio
The best way to demonstrate and quantify the impact of portfolio hedging is via a realistic case study. This is not based on a specific company’s portfolio, but the contract structures in our case study are common within large LNG portfolios.
For simplicity we focus on portfolio value across a single year (2021). But the logic can easily be extended across a longer time horizon.
The case study portfolio is relatively simple, consisting of two supply contracts and access to spot shipping capacity.
- Qatari supply contract: Buying 24 cargoes per year on a 50% Brent crude, 50% TTF index
- US tolling contract: Ability to export 12 cargoes per year from Corpus Christi on a Henry Hub indexed basis
- Shipping: access to shipping capacity via spot vessel charters.
We assume that all cargoes from the supply contracts are sold into regional spot markets (JKM, NW Europe & Sth Europe), accounting for appropriate bid/offer transaction costs. However the logic can easily be adapted to also incorporate term sales contracts (e.g. into China or India).
The case study is analysed based on current market forward curves (e.g. for TTF, JKM and Brent).
How do we model portfolio value?
In order to quantify portfolio value and the impact of hedging, we use our ‘LNG Bridge’ portfolio valuation model. This model has been used extensively with our LNG client base, across large LNG producers, traders and portfolio players. As such it has supported portfolio construction analysis, transactions & asset valuation, as well as being implemented as an in-house portfolio valuation modelling solution.
‘LNG Bridge’ is built around a sophisticated but transparent Monte-Carlo price simulation engine. The model simulates 500+ individual correlated price paths (e.g. Henry Hub, TTF/NBP, JKM, Brent) capturing the unique ‘regime’ based pricing dynamics in the LNG market.
For each price simulation, the model optimises & rehedges all components of the portfolio in response to market price changes. The model then provides a portfolio value distribution (intrinsic & extrinsic), hedge values, risk metrics and a final cargo schedule
Portfolio cargo schedule optimisation
The model optimises delivery of cargoes across the year to the highest value market, accounting for contract sourcing and shipping costs. Chart 1 shows the ‘intrinsic’ cargo sourcing and delivery schedule for our case study portfolio, optimised against current forward curves.
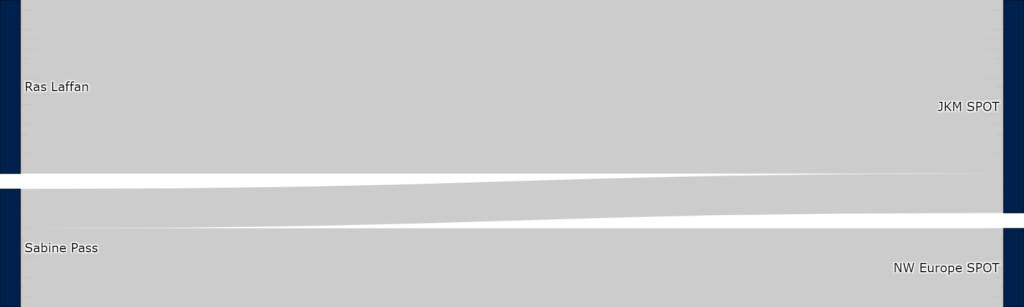
Source: Timera Energy LNG Bridge model
Qatari contract volumes are delivered to Asia (JKM) on an intrinsic basis. US contract volumes are split between NW Europe and Asia depending on seasonality of the price spread between the US and NW Europe vs Asia.
This simple intrinsic view illustrates cargo scheduling against a given set of market prices (current forwards). But it is important to note that portfolio value analysis is undertaken based on optimisation & hedging of the portfolio against multiple (e.g. 500+) correlated spot and forward price simulations, to build a proper ‘extrinsic’ view of portfolio value distribution (as we show below).
Impact of hedging key portfolio exposures
In order to understand the impact of hedging, it is important to define key portfolio exposures. The contract exposures in the case study contracts come from price indexation (e.g. exposure to Brent from a Brent price formula) and from the market exposure of the physical cargoes (e.g. exposure to TTF when delivering a cargo into NW Europe). These exposures are summarised in Table 2 and are based on the intrinsic schedule in Chart 1.
Table 2: Case study portfolio contract exposures
Hedging of these contract exposures relates to the intrinsic delivery schedule in Chart 1. For example the US supply contract exposure is hedged against both TTF and JKM in proportion to optimised intrinsic delivery into Europe vs Asia.
So what is the value impact of hedging these exposures versus doing nothing? We have modelled two cases to find out:
- No Hedging case – based on rolling optimisation of the portfolio against prevailing spot prices (this is effectively the strategy that LNG companies adopt when they choose not to hedge).
- Hedging case – based on a commonly adopted ‘rolling intrinsic’ hedging strategy, where exposures are fully hedged (where liquidity allows) at the start of the year, with hedges adjusted on a rolling basis as the year progresses (but only if hedge adjustments lock in a higher value than already hedged).
The resulting portfolio margin distributions for both of these cases are shown in Chart 2.
Chart 2: Hedged vs Unhedged portfolio margin distribution (across 2021)
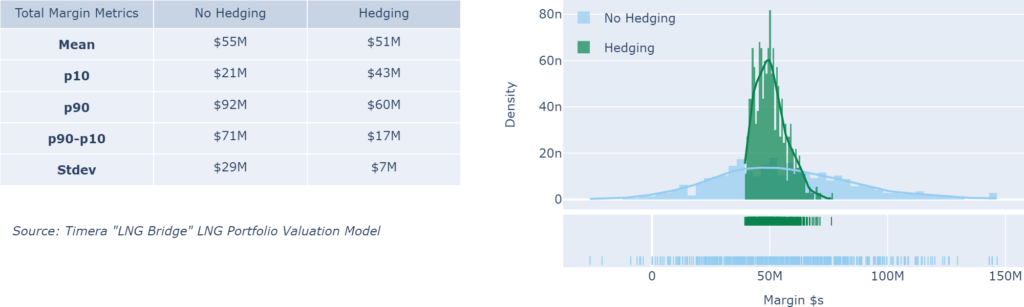
Source: Timera Energy LNG Bridge model
The ‘No Hedging’ case results in the light blue 2021 margin distribution in the chart. This shows the large spread of possible margin outcomes if the portfolio is unhedged (standard deviation from the mean of USD 29 million).
Margin variability of this scale has very real balance sheet and risk capital allocation implications, which we come to in the next section.
The ‘Hedging’ case results in the green margin distribution. This shows how hedging significantly reduces margin risk i.e. the margin distribution narrows (and standard deviation falls to USD 7 million).
The other key benefit from rolling intrinsic hedging, is realising the extrinsic value of LNG portfolios via forward hedge adjustments. The initial intrinsic hedge position limits the margin downside of the green hedged portfolio distribution. But the expected margin of the hedged portfolio is significantly higher, as re-hedging in response to market price moves generates incremental value.
There are three important factors to note with the ‘Hedging’ case:
- Transaction costs: Hedging incurs transaction costs which reduces expected (or mean) portfolio margin.
- Upside reduced: Hedging caps access to upside value (narrows the right hand tail of the margin distribution), as well as limiting downside.
- Residual risk: Not all portfolio exposures are fully hedgeable e.g. there is residual risk around hedges at the less liquid JKM (& illiquid regional spot markets).
The ability to quantify the impact of hedging on margin distributions for a complex LNG portfolio has some key practical implications for portfolio management and company balance sheets.
Hedging frees up capital to create value
A well positioned LNG portfolio with the right exposures and supply chain flexibility, can generate a lot of margin quickly. The most obvious examples of this have been in tightening markets with high regional price spreads and volatility e.g. post Fukushima and during the volatility of 2018.
However on the other side of the margin distribution, LNG portfolios also typically carry large risks and potential value downside (e.g. during the 2016 and 2020 price slumps). Downside margin variability needs to be supported by risk capital i.e. an allocation of balance sheet capacity. This can be done explicitly via risk capital allocation. Or it can be more implicit via balance sheet buffers.
Managing risk capital is not a theoretical exercise. Being able to support portfolio value downside has very real implications for company balance sheets.
For example in our case study above, we estimate a risk capital requirement of USD95 million to support the unhedged portfolio. Required risk capital falls to USD 25 million for the hedged portfolio, freeing up USD70 million of balance sheet capacity to deploy elsewhere.
Hedging a portfolio and reducing downside risk, frees up balance sheet capacity. And this risk capital can be productively invested to support LNG portfolio growth or other value creation.
Click here for briefing pack with more information on our LNG Bridge model and associated case studies.