Let’s start with some simple maths. Europe has historically relied on at least 150 bcm of annual Russian gas imports. With the sabotage of the Nord Stream pipeline and an uncertain outlook for Ukrainian transit, Russian annual flows could fall below 15 bcm from 2023.
“Current market prices are multiples of long run investment costs… but it’s not that simple”
That would leave Europe with an annual supply gap of 135 bcm (~ 100 mtpa equivalent). Some of this gap will be plugged by demand destruction, albeit with nasty side effects in the form of economic pain. Plugging the rest of Europe’s gap will rely strongly on incremental LNG imports (with some relatively small potential volume upside from Norway & Algeria).
In today’s article we focus on how the supply side of the LNG market has responded to the explosion in European demand in 2022. We then look at how Europe’s structural pivot from Russia to LNG is shaping a new supply wave.
Global LNG supply response in 2022
Europe imported around 137 bcm of LNG from Jan to Oct 2022. This is up 40% year-on-year. One of the under emphasised stories of 2022 is that despite the incentive of record LNG price levels, global LNG production volumes have been weak on a relative basis.
As Chart 1 illustrates, global liquefaction capacity utilisation, which accounts for new export terminals, has fallen in 2022 (green line) vs the 4-year average (blue line).
Chart 1: Global liquefaction capacity utilisation
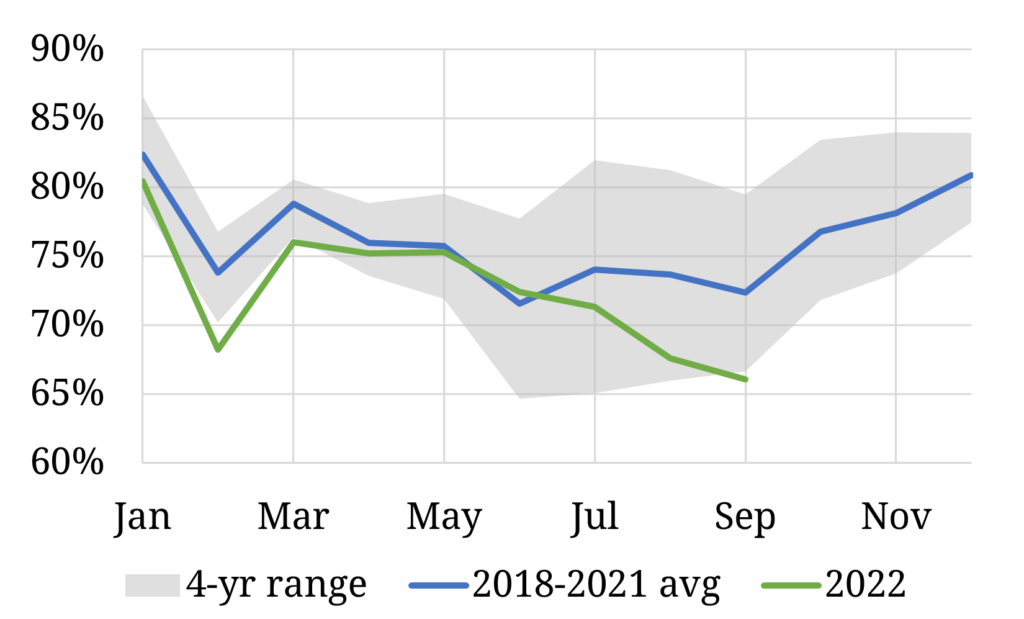
Source: LNG Unlimited, Timera Energy
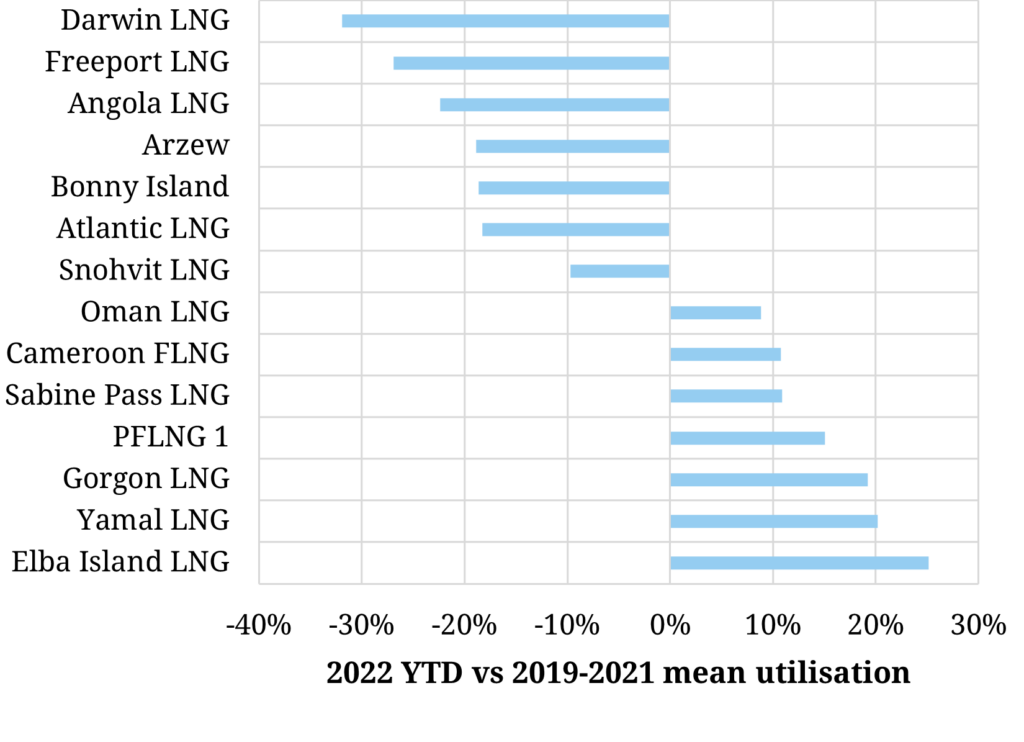
Chart 2 sheds some more light on liquefaction utilisation at a supply project level.
The relatively weak LNG production performance is focused on two drivers:
- Feedgas issues due to upstream production constraints (e.g. Darwin, Nigeria, Trinidad)
- Maintenance or technical issues (e.g. Snohvit, Freeport).
Even some of the projects that appear to exhibit higher utilisation in 2022 relative to recent years are only showing increases due to constrained output previously (e.g. Gorgon, Prelude). Some of the US project gains also reflect the impact of lower 2020 production during the Covid induced price slump.
In summary, while global LNG supply has increased year-on-year, this has been driven by new capacity coming online in the US (Calcasieu Pass, Sabine Pass T6), as opposed to an improvement in the performance of existing terminals in response to high prices. As a result, most of the incremental LNG Europe has imported in 2022 is a function of high prices inducing demand destruction and fuel switching in Asia, not a supply-side production response.
Investment in new supply
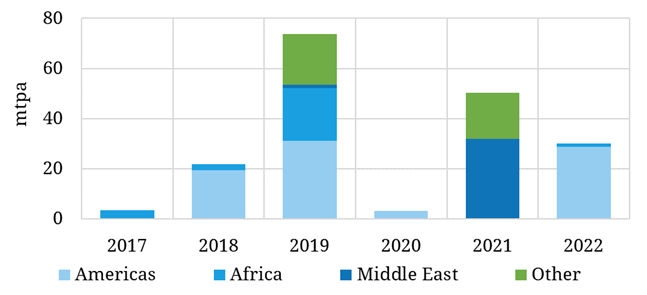
Near term LNG production response may be weak, but record prices are triggering investment in new supply projects. The challenge is that average project lead times are around 5 years. Chart 3 shows the volumes of new liquefaction capacity taking FID (Final Investment Decision) across the last few years.
Chart 3: Global liquefaction capacity FID volumes
Timera EnergyTimera Energy
A total of 79 mtpa of new projects have been FID’d so far across 2021-22, supported by the tailwind of surging prices.
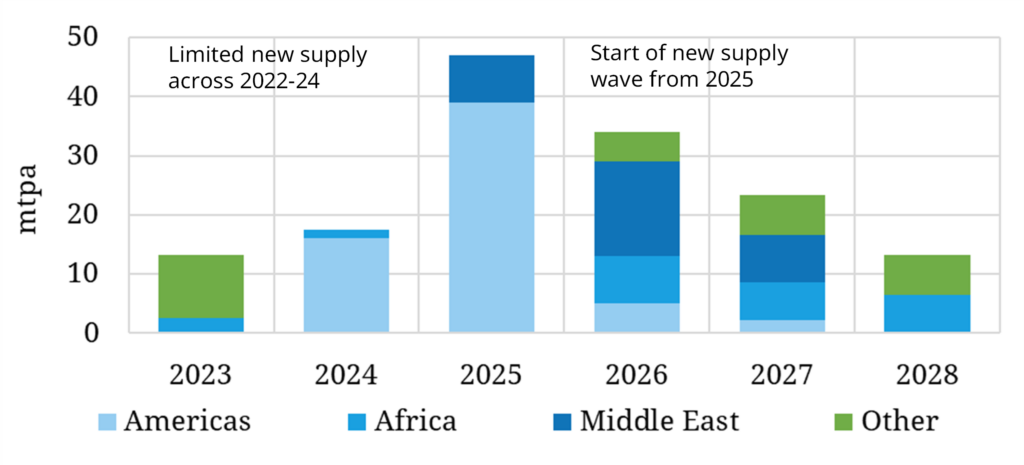
Chart 4 shows our estimate of incremental supply volumes coming online based on projects that have taken FID to date.
New supply in 2023 & 24 is very limited. This reflects the hiatus of FID’s taken late last decade in a lower price environment as well as general headwinds for capex investment in fossil fuel projects. Limited new liquefaction capacity until 2025 combined with a leap in European demand support the continuation of the current regime of higher and more volatile prices across the next 2 to 3 years.
From 2025 a supply response to the current crisis starts to kick in. The substantial increase in new supply in 2025-26 is focused on new US export projects and new Qatari trains. This is set to be a period of market rebalancing as supply plays catch up with incremental demand. Market regime dynamics from 2025 are going to depend strongly on how global LNG demand evolves in the meantime.
Is the new supply wave done?
The Long Run Marginal Cost of new LNG supply is estimated to be somewhere in the 8-10 $/mmbtu range. Current market prices in Europe are multiples of these investment cost levels (e.g. Calendar 2023 TTF price is around 36 $/mmbtu).
These conditions at face value appear to be very constructive for inducing investment in new LNG supply. But as is often the case with markets it is not that simple.
Investors in new supply need some form of long-term contract to back off investment risks and ensure a return on capital. In the case of US export contracts this is via a liquefaction capacity fee (with feedgas costs typically passed through on a market index to buyers). For other projects, upstream feedgas investment costs also need to be covered via contracts e.g. Qatari and East African gas.
Despite very high market prices, new liquefaction projects are struggling to find long term offtakers. Chinese buyers have been aggressively buying longer term contracted gas to reduce their exposure to spot gas. But most other buyers in the market are wary of committing on a long-term basis.
European & developed Asian economy buyers are wary of signing 15-20-year contracts given the momentum behind decarbonisation policy and associated demand uncertainty. Many developing market buyers of LNG are structurally reassessing their appetite for exposure to what is currently an expensive and volatile energy source. Developing buyers also face challenges with the credit risk profile needed to sign long term SPAs.
That leaves large LNG portfolio players with a key role in shaping the next wave of supply. Majors (e.g. Shell, BP & Total) and large traders (e.g. Gunvor, Vitol & Trafigura) have the balance sheets to warehouse risk. They also have the physical portfolios to monetise supply chain value and manage changes in pricing dynamics and market liquidity. Many of these portfolios still have appetite to grow LNG length, but are focused on investments in flexible (e.g. US) or cost competitive (e.g. Qatar) supply.
The contracting & investment activity of these portfolio players will be a crucial factor to watch in how the new supply wave takes shape.
Join our LNG ‘Regime change’ webinar on Nov 17th
Webinar registration link
- Time & access: 8am GMT (9am CET, 4pm SST); free access
- Topic: “Regime change” – Impact of a new market regime on LNG portfolio value
- Content:
- Supply & demand balance impact of European pivot from Russian gas to LNG
- Resulting shift in market pricing dynamics (e.g. price levels, marginal price setting, volatility)
- Implications for LNG portfolio construction (e.g. role of Europe, new supply, value of flexibility)
- Implications for portfolio value management (e.g. European access, shift to ‘within portfolio’ optimisation)
- Impact on risk management (e.g. portfolio hedging; credit risk & collateral issues)