Renewable output is growing fast across North West European power markets. Wind & solar output in Germany accounts for more than 30% of demand. Include other renewables (e.g. hydro & biomass) and this share rises to more than 40%.
Rising renewables penetration is resulting in an increasing number of periods where thermal plants are completely displaced in the merit order. During these periods, power prices can temporarily plunge to low or even negative levels as other forms of lower variable cost capacity set prices (e.g. nuclear, biomass or wind).
Despite rising price volatility associated with intermittency, CCGT and coal plants remain the dominant driver of power prices across NW Europe. Even with a 40% renewable market share in Germany, thermal plants are setting the power price most of the time (sitting on the margin above wind & solar output in the stack). This is particularly evident in the very strong forward curve relationship of power prices versus gas, coal & carbon prices.
It is this forward curve relationship that we look at today. Some major shifts in the relative costs of gas & coal plants in 2019 are having an important impact on the evolution of power prices and generation margins. These are in turn causing a shift in competitive balance and generation asset returns.
4 charts tell the story
Spark and dark spreads are a benchmark for the generation margins for CCGTs and coal plants respectively (power price minus variable cost). These spreads provide an important insight into power market pricing dynamics.
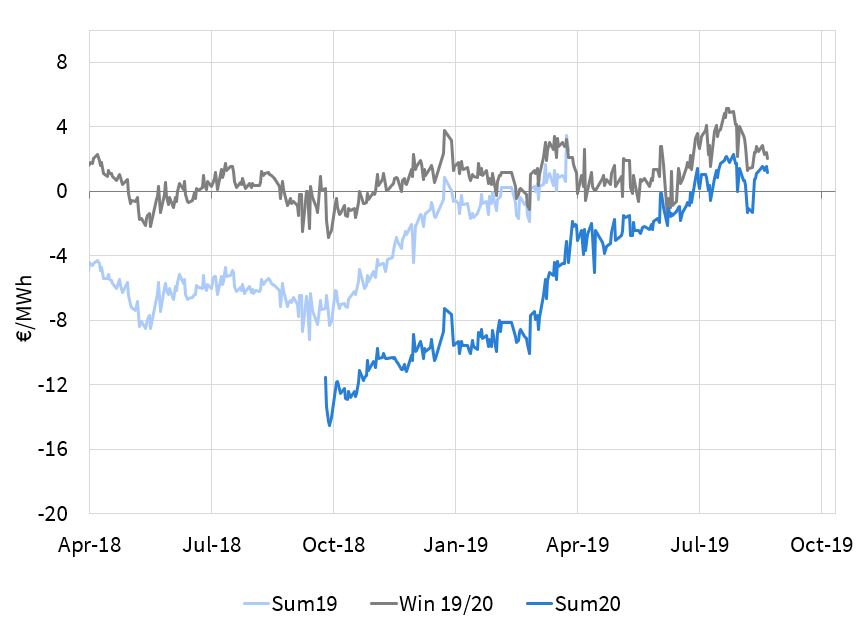
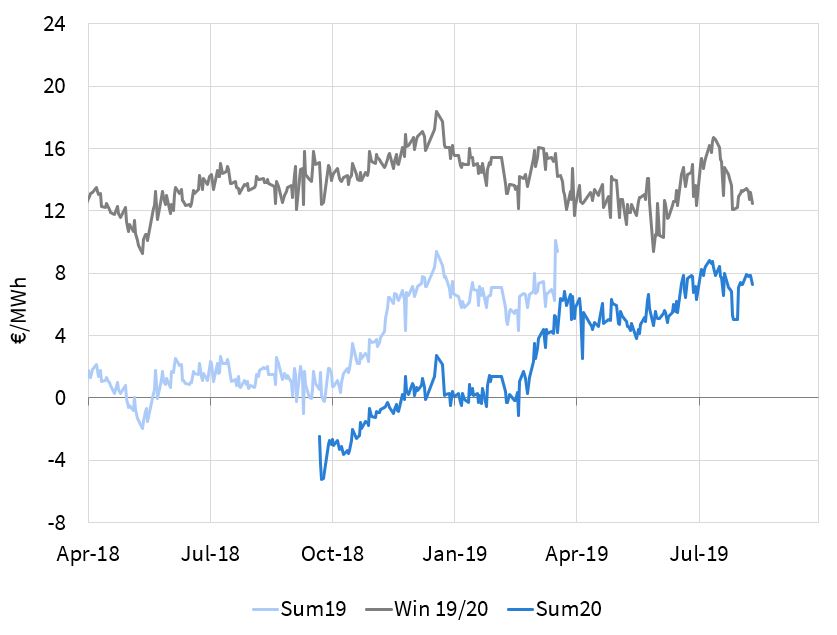
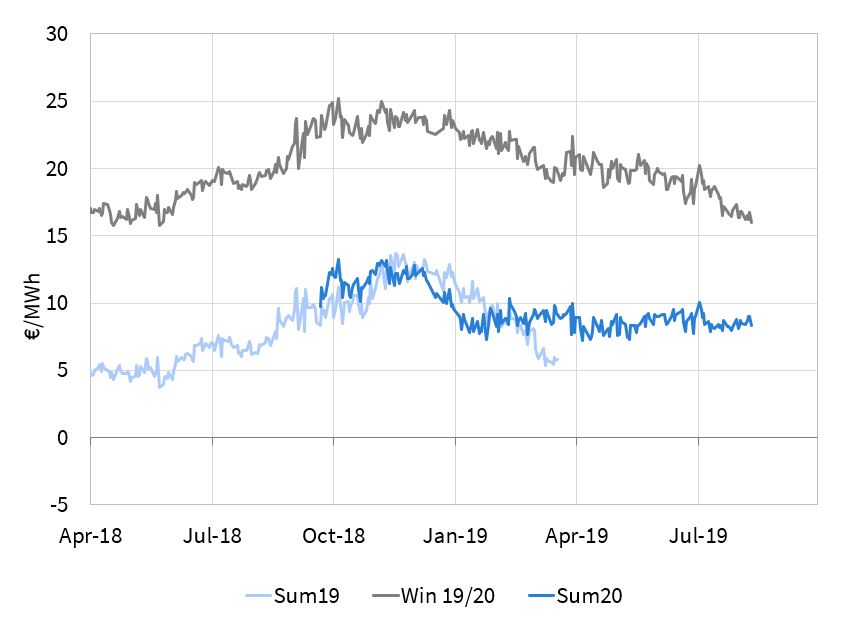
The top two panels in Chart 1 show Baseload & Peak German forward Clean Spark Spreads (CCGT margins) in Germany across the last 18 months. The bottom two panels show Base & Peak Clean Dark Spreads (coal plant generation margins). The 3 lines on each chart show:
- Light blue = Summer 2019
- Grey = Winter 2019/20
- Darker blue = Summer 2020
Winter
CCGTs are the dominant setter of marginal power prices across the winter. This is reflected in a relatively stable CSS level (grey line in the top panel). As gas prices have declined over the last 12 months, CCGT variable costs have fallen and this has fed through into lower power prices. In other words, falling gas prices have been dragging power prices lower.
The bottom panel show how falling gas prices have also been hurting coal plants. Lower power prices are feeding through into lower CDS, with Baseload Win 19-20 CDS falling by 50% since Q4 -18 (from 8 €/MWh to just above 5 €/MWh). Coal plant load factors and margins are following suit.
The ‘market’ CDS shown in Chart 1 do not include coal transport costs, which further reduce achieved dark spreads. These vary by asset, but range from 2 to 8€/MWh.
Summer
Lower gas prices across summer periods have seen coal plants relegated to a peaking role. This is reflected by a relatively stable Peak CDS across Sum-19 and Sum-20.
The influence of higher variable cost coal plants supporting summer prices has been good news for CCGTs. The top two panels show a big recovery in CCGT generation margins across summer periods as gas prices have fallen across the last 12 months. Lower gas prices are translating into higher CCGT load factors and higher margins.
At the start of Q4-18, Baseload CSS was deeply negative (- 7 €/MWh for Sum-19, – 12€/MWh for Sum-20). Even Peak CSS was hovering around zero. In other words CCGTs were structurally ‘out of the money’ on a forward price basis.
Since then Baseload CSS has surged into positive territory, with Peak CSS rising to around 8 €/MWh for Sum-20 (yes that’s with a positive sign in front of it!). In other words CCGTs are structurally back ‘in the money’ across both next winter and summer.
What does this mean going forward?
We use Germany to illustrate spread and price formation dynamics as it sits at the core of the interconnected network of North West European power markets. But the same dynamics are impacting neighbouring market (e.g. France, Netherlands & Belgium).
The shift that has taken place in relative fuel prices means that power prices across NW Europe have become more strongly linked to gas prices, and less influenced by coal. This reinforces the importance of the gas market in understanding power price dynamics.
The other dynamic that is occurring, almost under the radar, is a significant recovery in CCGT margins in NW Europe. After almost a decade of margin erosion and asset writedowns, CCGTs are in the money again.
The CCGT value recovery story could have more to run. There are some important structural drivers that are set to support CCGT load factors and margins over the next 3-5 years. We will address the evolution of CCGT value soon in a follow up article.