A surge in European LNG imports in 2019-20 has been matched by a rising interest from market players to acquire regas capacity.
“The value of regas depends on the ‘in the moneyness’ of the option to monetise LNG cargos at European hubs. “
Buyer interest spans US export offtakers, Asian buyers, commodity traders and large integrated LNG portfolios. These companies recognise that regas is the bridge that allows LNG portfolio access to European gas hub liquidity. And the value of regas access is rising in a world awash with surplus cargoes.
Quantifying the value of regas capacity is not a simple exercise. We set out a breakdown of 4 categories of LNG regas value in an article in Q4 2019, covering:
- Merchant slot value (standalone market value of capacity)
- Portfolio slot value (incremental value specific to individual portfolios)
- Send-out optimisation value (associated with profiling send out from storage)
- Reload value (from ability to manage logistics and ‘bypass’ contract destination clauses)
In today’s article we focus on how to quantify merchant slot value.
Regas capacity is an option on hub access
In order to set out a framework for valuing regas capacity we focus on a North West European example based around the TTF hub. But the logic is relatively easy to adapt for other locations/hubs.
In layman’s terms, regas capacity provides the owner of an LNG cargo in NW Europe with the option to liquefy and monetise gas at TTF.
In more technical terms, regas capacity represents a strip of put options on the spread between:
- The NWE Spot price and
- the TTF price
The strike on these options is equal to the variable costs of regasification and transporting gas to the hub.
TTF benefits from transparent spot and forward curve liquidity. The NWE Spot price on the other hand is a relatively illiquid benchmark for the value of spot cargoes bought & sold in NW Europe. This issue is somewhat mitigated by its link via netback cost relationships to other regional price markers e.g. the key JKM marker in Asia.
The relationship between NW European spot cargo prices and TTF depends on the prevailing balance of the LNG market.
Regas value is driven by LNG market balance
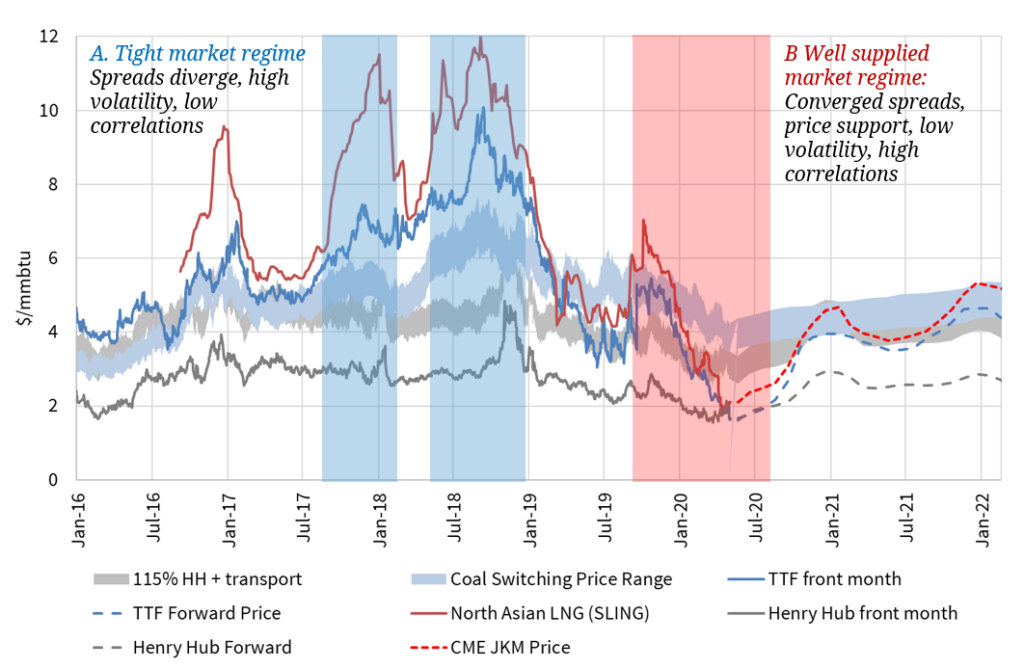
LNG market balance can be characterised as transitioning between two different ‘regimes’ as illustrated in Chart 1:
- ‘Well supplied’ regime: where gas price levels are low, regional price spreads converged, price correlations high and price volatility supressed (as is currently the case)
- ‘Tight’ regime: with higher gas price levels, regional price spread divergence, lower correlations and higher volatility
These regimes can be further subdivided into market ‘states’ as we set out below.
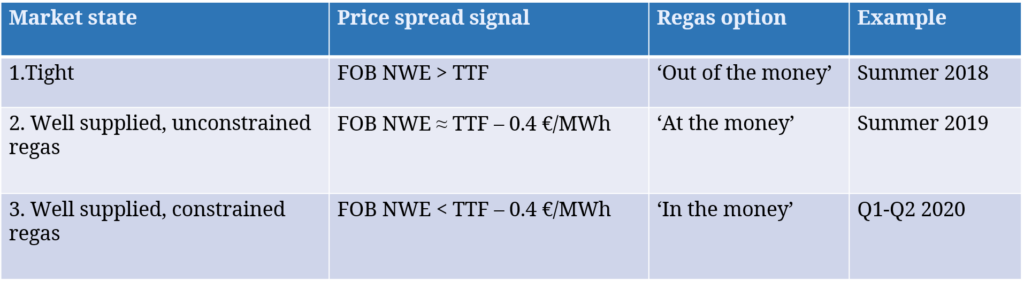
The value of regas capacity depends on the ‘in the moneyness’ of the option to monetise LNG cargos at NW European hubs. This is driven by the prevailing level of the NWE Spot minus TTF price spread, which can be characterised in three ‘market states’ as set out in Table 1.
For simplicity in the table, the regas option strike is assumed to be 0.4 €/MWh, broadly consistent with the variable cost of regulated regas terminal access across NW Europe.
State 1 reflects a ‘tight’ LNG market, where other regions are pulling flexible LNG away from Europe. This causes the NWE Spot price to rise above TTF i.e. NWE Spot > TTF, with netbacks to NW Europe rising as a result of higher bids for cargoes in Asia and other regions. NWE regas is ‘out of the money’ in this case i.e. it has no intrinsic value (but retains extrinsic value).
State 2 reflects a ‘well supplied’ market with flexible LNG flowing into Europe, but with NW European regas capacity access remaining unconstrained. In this case the NWE Spot vs TTF price spread converges to a soft lower bound set by the variable cost of regas terminal throughput (0.4 €/MWh in our simple example). This is because surplus cargoes are flowing to Europe but there is a ‘large European gas market bid’ supporting the NWE Spot price at TTF minus the variable cost of hub access. Regas capacity is ‘at the money’ in this case.
State 3 reflects an extension of Case 2, where a ‘well supplied’ market causes regas capacity access constraints in NW Europe, as has occurred over periods during 2019-20. In this situation, the inability to monetise cargoes at TTF means that cargo owners need to discount prices (pulling down the NWE Spot marker) to incentivise buyers with regas slots to buy & deliver. Regas is ‘in the money’ in this case and has clear intrinsic value.
What’s been happening recently?
It is easiest to understand the framework for regas valuation we set out above by relating it to recent market conditions. In Chart 2 we show the evolution of European regas terminal send out volumes since the middle of last decade.
Chart 2: European regas send out volumes by country (LH) and year (RH)
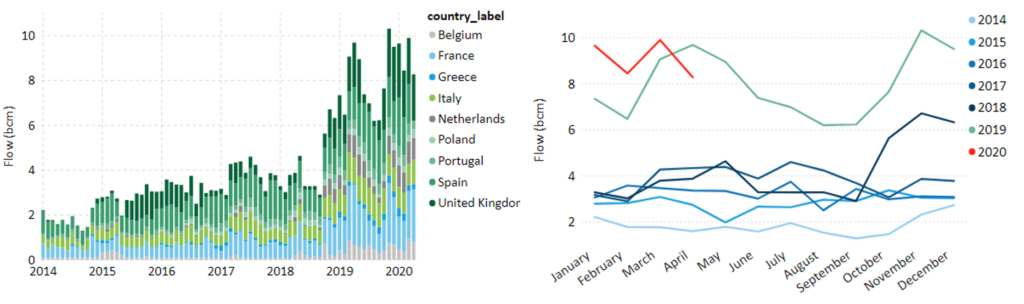
Source: Timera Energy & ENTSOG
The impact of ‘tight’ market regimes in 2017 and 2018 (shaded blue in Chart 1) can also be seen in Chart 2 via lower regas utilisation (as Asia pulled flexible LNG away from Europe).
The shift in market regime from ‘tight’ in summer 2018, to ‘well supplied’ across 2019-20 stands out clearly in the right hand panel of Chart 2, with regas utilisation surging.
The ‘well supplied’ market regime since Q4 2018 has seen the Spot price pushed down below TTF, as surplus cargoes flow into Europe. In periods of unconstrained regas terminal access across 2019-20, the NWE Spot price has hovered around a 0.4 €/MWh discount to TTF, reflecting the variable costs of regasification and hub access (State 2 above).
But there have also been periods of regas access constraints (particularly around key terminals such as GATE), which have seen NWE spot cargo prices driven to larger discounts to TTF (State 3 above). In these situations, the owners of regas capacity are harvesting a premium from their ability to access hubs to monetise cargoes.
Quantifying merchant regas capacity value
The challenge quantifying the merchant value of regas capacity is the lack of transparency and forward liquidity of LNG market prices (e.g. NWE Spot). In practice, regas value is most commonly monetised via internal optimisation within a portfolio (rather than on a standalone basis against market price signals).
A lack of market liquidity inhibits the ‘mark to market’ & hedging of regas capacity. But it does not prevent regas valuation.
Regas capacity valuation is driven by:
- The expected probability of being in each of the 3 states in Table 1
- The expected payoff when in each of these states.
While regas capacity can be valued on a standalone merchant basis, value is typically much higher when considered in a portfolio context. For example European regas can unlock significant portfolio value when combined with flexible supply sources to create spread optionality between Europe and Asian markets.
The key challenge in valuing regas capacity over a multi-year forward horizon is price uncertainty. If you base valuation on a price forecast, the only thing you know with certainty is that you will be wrong.
This is why using prices simulations (e.g. 500+) to define the distribution of regas capacity value is important. Valuation is best achieved using a monte carlo based price simulation engine that can properly capture the transition in LNG pricing dynamics that occurs as market balance shifts between states.
For more information on this approach, see link below with details on the solution we are implementing with a number of large LNG portfolio players to support regas capacity valuation.
Future drivers of regas capacity value
Looking forward over a multi-year horizon, the value of regas capacity will of course be driven by supply and demand.
Supply of European regas capacity has been relatively stable for the last five years after a rush to develop terminals earlier this century. But the renewed appetite for regas across 2019-20 has rejuvenated interest in new capacity developments.
For example, potential new capacity sources include new German terminals (Wilhelmshaven + Brunsbuettel), French terminal expansions (Montoir, Fos Cavaou), Isle of Grain expansion in the UK, a floating regas terminal in Croatia and expansion of the Polish terminal.
But the next round of regas terminal developments look to be significantly more challenging than the last, given reduced appetite from offtakers to sign long term contracts at price levels which underpin terminal capital costs. That means new terminal developments may be constrained by the availability of balance sheets to provide capital.
The notable exception in signing long term contracts has been Qatargas who have recently bought substantial volumes of existing terminal capacity in anticipation of upstream expansion.
On the demand side of the regas equation there are two structural drivers of higher utilisation over time:
- Declining domestic gas production in Europe, increasing import dependency
- Rapidly rising volumes of flexible LNG (e.g. US exports), which can flow into Europe during periods of a well supplied LNG market
These factors may combine to cause an increasing frequency of periods of European regas capacity constraints as the 2020s progress.
Briefing pack: Steering from the Bridge (click on this title for PDF)
This pack sets out key commercial challenges, portfolio analysis methodology, pitfalls and further practical case studies. The pack draws on Timera Energy’s recent work where we’ve been engaged by a number of large LNG portfolio players to deliver portfolio analysis solutions. |