Crude prices have broken through some key resistance levels over the last two weeks. Brent front month futures pushed above 60 $/bbl for the first time since Jan 2015. This helped drag the US WTI benchmark above 55 $/bbl shortly after.
This bullish breakout in oil prices comes against the backdrop of an intense energy industry debate about the long run future of oil. Many senior industry participants are projecting ‘peak oil’ to occur at some stage next decade.
The logic behind peak oil projections is an anticipated decline in the use of oil as a transportation fuel. This is the result of the increasing penetration of fuel-efficient engines and electric vehicles. The arguments to support this logic are sensible and it is interesting that the peak demand thesis has now surpassed the peak supply narrative.
But there is an important question of timing. Over the remainder of this decade, there are stronger forces driving the oil market than a fear of peak demand.
Strong demand & cuts rebalancing market
Global oil demand growth is strong and has been so for three years. Global demand rose by 2.0 million barrels per day (mb/d) in 2015 and 1.6 mb/d in 2016. Demand growth for 2017 is forecast to be 1.6 mb/d. Demand is being supported by lower prices and relatively strong global economic growth since 2015.
On the supply side, OPEC’s production cuts are helping to steadily erode global oil inventories. The current production cut agreement expires in Mar 2018 with a meeting on Nov 30th likely to see OPEC extend cuts beyond this. OPEC have indicated a willingness to extend, possibly by 6 to 9 months, and this has been a key factor supporting the recent price rally.
The excess of OECD oil inventories over their 5 year average levels has fallen by more than 50% in 2017, with inventories currently at around 160 million barrels. If current trends continue, inventories are likely to return to the 5 year average at some stage in 2018.
What are crude futures prices telling us?
Oil market sentiment has been weighed down by bearish supply side drivers for the last two years. This has reflected the threat of lifting of OPEC production caps (or non-compliance), given significant production headroom particularly from Saudi Arabia and Russia. Large incremental volumes of US unconventional oil production also loom over the market.
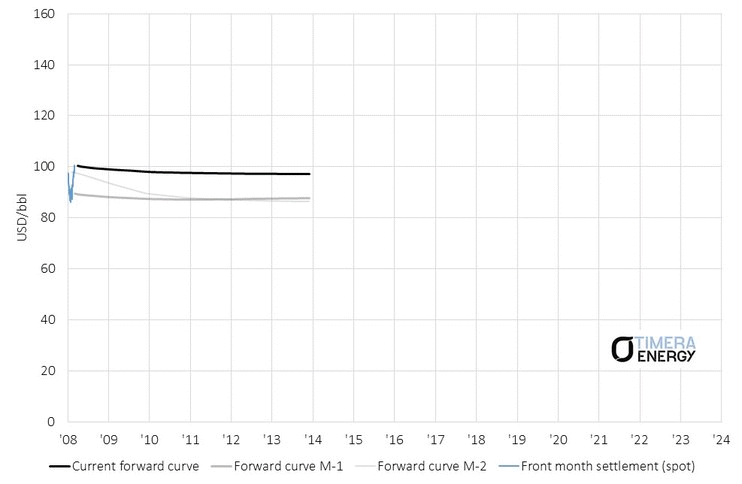
But despite these supply side threats, crude price behaviour in 2017 is being driven by a tightening global market. Chart 1 shows an animation of the monthly evolution of the Brent futures curve over the last 10 years.