Two European gas market records were broken in March. Both LNG and Russian monthly import volumes surged to their highest levels in history. This has meant that gas is being pushed into the European market at an unprecedented rate.
Prices have responded accordingly. As we set out last week, the US LNG shut in price range is now sitting just below current TTF price levels. This should represent major price support.
In the meantime, the power sector is driving European gas prices. In today’s article we explore gas for coal switching dynamics and the key power markets that are providing incremental gas demand.
Record high supply volumes
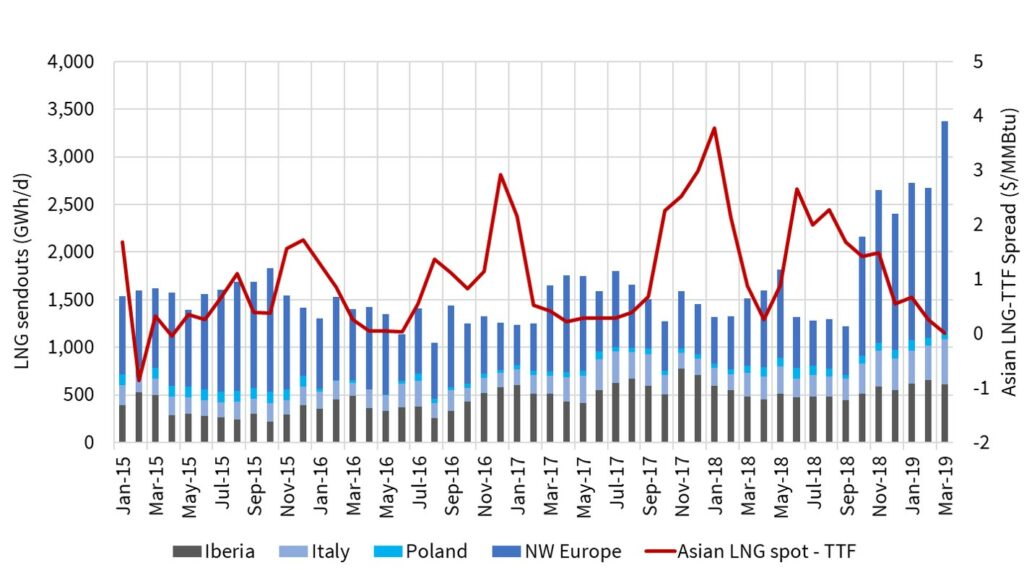
We start by looking at a pair of charts that provide some context for the record LNG & Russian import volumes in Mar-19. Chart 1 shows average daily send out from European regas terminals. The last six months clearly illustrate the role of liquid NW European hubs as a sink for surplus LNG cargoes.
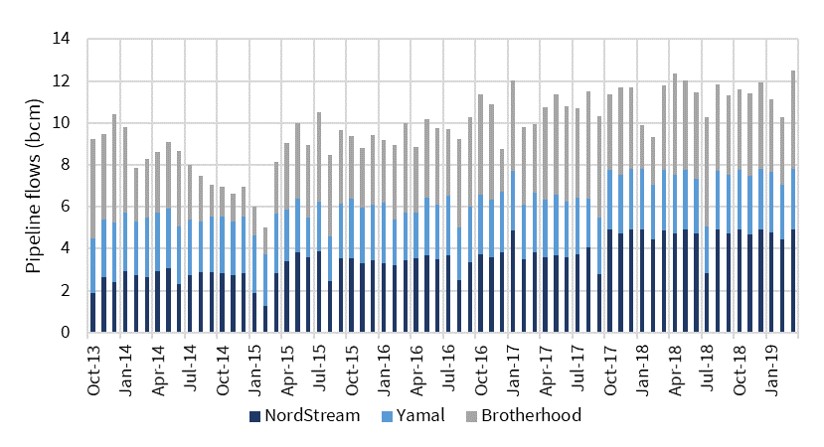
Gazprom has not flinched in the face of record LNG import volumes as shown in Chart 2. Its favoured Nordstream (Baltic) and Yamal (Belarus) import routes have been flowing at max capacity across most of the last 18 months. But in Mar-19 flows via the Ukraine/Slovakian route also ramped up to near maximum capacity.
It may be that Russia sees a strategic silver lining in temporarily lower gas prices, if this delays a growing queue of new LNG projects targeting FID in 2019-20. Some temporary price pain now may reduce the competitive threat from new LNG supply in the early to mid 2020s.
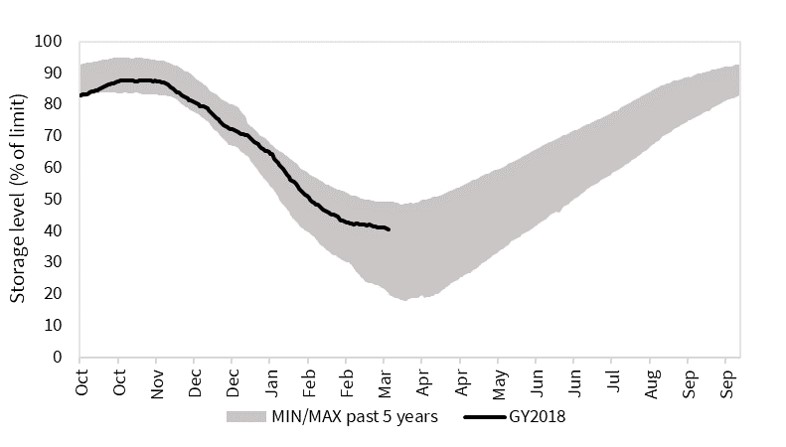
The other factor currently weighing on summer gas prices is unusually high European storage inventories (~20% higher than last year) shown in Chart 3. This means storage injection will not play its usual role in supporting summer gas demand.
The switching rubber band effect
It is clear from the three charts above that the supply side of the European gas market is not currently very responsive to price levels. That shifts the focus to the power sector as the price responsive component of gas demand.
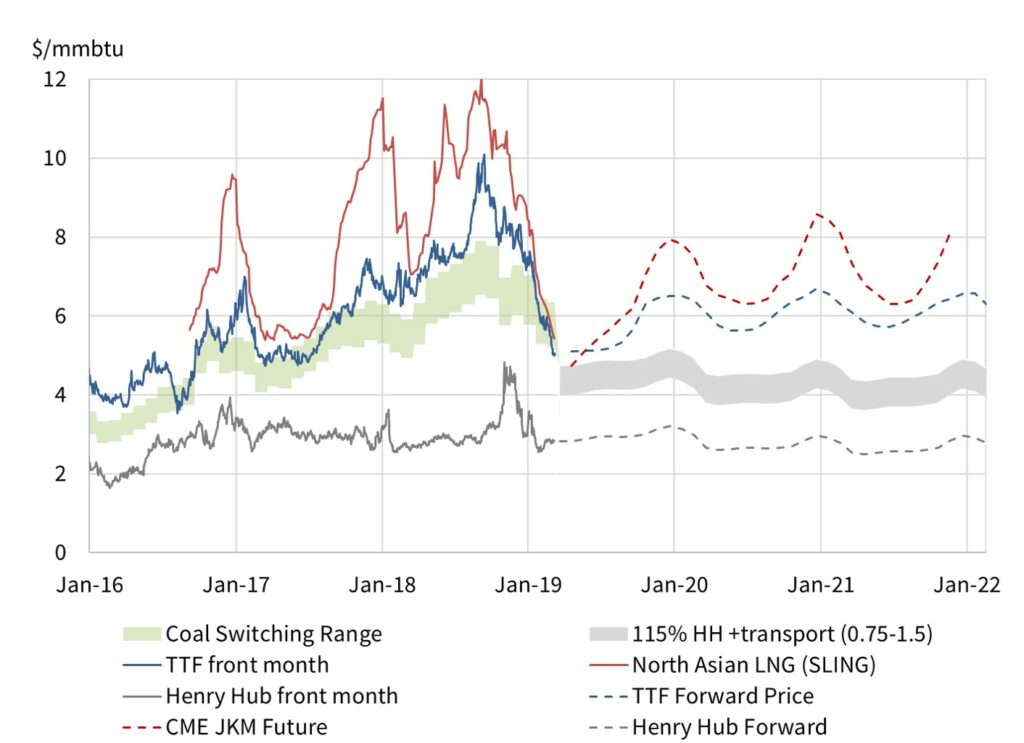
Liquid price signals for gas, coal and carbon mean that gas for coal plant switching in European power markets is a dynamic response mechanism to lower gas prices. This can be seen in Chart 4 which shows the strong relationship between TTF spot prices (blue line) and the gas for power switching price range (shaded in green).
Switching is often referred to as a dynamic that happens at a given price level. But in reality the competitive dynamics of gas vs coal plant vary by market, with plant efficiencies and with other differences in variable costs (e.g. coal transportation costs).
The top end of the green range on Chart 4 represents the gas price level at which more efficient CCGTs (52% HHV efficiency) start to displace less efficient coal (40% efficiency). The bottom end of the range is based on the TTF price at which less efficient CCGTs are displacing more efficient coal plants. The switching range moves dynamically with coal and carbon prices (the drivers of coal plant variable cost).
The chart shows that historically switching has provided strong support for TTF prices which tend to bounce off the top end of the range. In times of temporary surplus, TTF prices can push down into the switching range, but this is a bit like pushing on a taught rubber band i.e. the resulting incremental gas demand tends to push prices back up again.
At the end of Mar-19, TTF prices broke through the bottom of the switching range. This is a rare occurrence and it illustrates the extent of surplus gas at hubs last month.
This does not mean that switching potential in European power markets was exhausted. The switching range is only a benchmark guide overlaid on a more complex interaction between hundreds of gas & coal plants across Europe. To understand what is going on behind this benchmark we need to look at a breakdown of Europe’s key power markets.
Understanding Europe’s switching potential
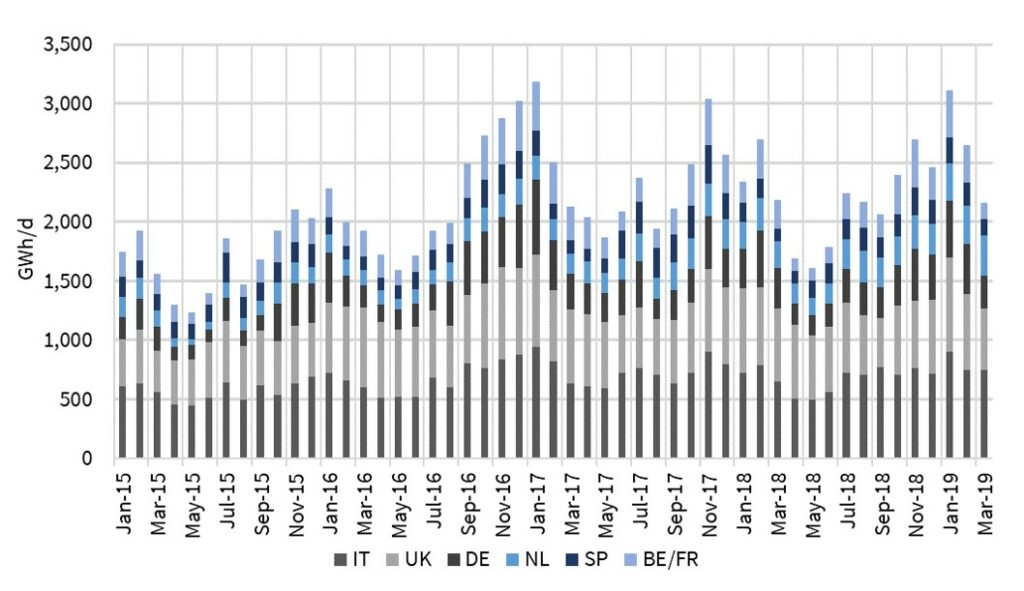
Chart 5 shows monthly gas demand across the key European switching markets (UK, Italy, Germany, Netherlands, Belgium, France and Spain).
Power sector gas demand was high across the first part of last winter, particularly in January where it reached levels not seen since the major French nuclear outages of two years ago. This high demand was partly the result of switching, but also reflected some cold weather in Q4.
March is however a different story. Warmer weather and high wind output saw a significant reduction in output from gas-fired power plants. This illustrates the seasonal pattern of power sector gas demand. Demand falls as summer approaches, meaning that gas prices need to push further into the switching range to induce a similar volume of gas demand response versus mid winter.
The UK power market sits at the bottom of the switching merit order given an 18 £/t carbon price floor which disadvantages coal relative to gas. The largest block of switching potential sits across the NW European Continental markets. This covers Germany / Netherlands (very well interconnected and with high volumes of coal & CCGTs) and to a lesser extent France & Belgium. In southern Europe Italy is important given a high volume of CCGT capacity as is Spain (although gas burn can be strongly linked to hydro conditions).
Switching & US shut ins working against further declines
In an article last year we set out our estimate of 20-30 bcm of potential incremental European gas demand from power sector switching. The exact volume is strongly dependent on the relative price levels of gas, coal and carbon. This power sector response mechanism represents a big ‘rubber band’ acting to support TTF prices around switching range price levels.
The two most likely sources of further downward pressure on TTF come from (i) a continuation of high LNG & Russian import volumes into summer and (ii) further declines in coal & carbon pulling down switching levels.
But there is a second and larger rubber band looming below in the form of US LNG export shut ins. As we set out last week, 2019 US shut in volume potential is 55 bcm (40 mtpa).
Support for gas prices may have been thin across the 50% decline of the last 6 months. But there is some major support between 4-5 $/mmbtu. Don’t be surprised if European & Asian gas markets start to stabilise from here.