Changes to the UK power market have been coming thick and fast this decade. The implementation of a Capacity Market in November 2014 is just one of a growing list of market reforms. But the Capacity Market is set to have a unique & structural impact on UK power market dynamics and asset values. Replacing an energy only market with separate energy and capacity markets is quite a dish to swallow.
Two factors make the Capacity Market a big deal:
- It introduces a new revenue stream for UK power plant, in addition to the current wholesale market revenue stream
- It gives the government the ability to tightly control the level of capacity in the market
These factors will have a key impact on wholesale power prices and the return on generation assets. From 2014 onwards, commercial and investment decisions will involve taking a view (either explicitly or implicitly) on the level and dynamics of pricing in the new Capacity Market. In this article, the second in our series on the Capacity Market, we look at the drivers behind capacity pricing.
How will capacity prices be determined?
Up until late last year, a lack of detail on Capacity Market design from DECC (the Department of Energy and Climate Change), made it difficult to draw meaningful conclusions on capacity pricing. That is starting to change. There are still many design factors to be resolved before the first auction in November. But there is now enough detail to start drawing some sensible conclusions on capacity pricing dynamics.
We start with a basic overview of the market mechanism that will set capacity prices. If you are familiar with the capacity market design, you may want to skip ahead to the next section.
Capacity Market overview
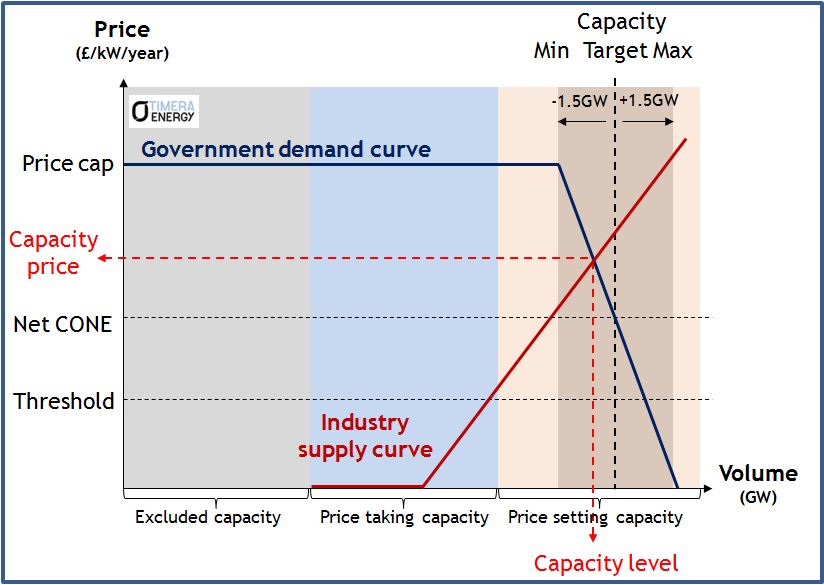
Chart 1 shows a representation of supply and demand in the Capacity Market.
Demand
The capacity demand curve (illustrated by the blue line in Chart 1) will be derived by DECC and announced in advance of each auction (the first one is due to be published in June 2014). It sets a price cap above which DECC considers it is not worth acquiring additional capacity. The cap level is yet to be confirmed but is likely to be related to the estimated cost of building a new gas plant.
DECC’s demand curve will be downward sloping at prices below the cap to reflect an increasing appetite for capacity at lower prices. However there will only be a 1.5 GW range above & below the target level.
Supply
The supply curve (illustrated by the dark red line in Chart 1) consists of bids from industry participants to provide incremental volumes of capacity at specified prices. Unlike the demand curve, the composition of the supply curve is not visible in advance of the auction. Instead it is partly revealed as the descending price auction uncovers which participants have successfully bid to acquire capacity rights.
Any capacity receiving another form of government support (e.g. RO, FiT/CfD, RHI) is excluded from the market, along with any capacity that chooses to opt out (e.g. retiring plant). The remainder of capacity falls into two tranches:
- Price setters: new or substantially refurbished capacity looking to recover major capex costs in 3 to 10 year capacity agreements, which can bid accordingly to set the capacity price.
- Price takers: existing capacity that is not looking to recover major new capex costs and can bid for 1 year capacity agreements, but is restricted to bidding below a government determined threshold level (yet to be announced).
Clearing price
The rest is Economics 101, with the marginal bid setting the capacity price which is paid to all market participants. The characteristics of the demand curve are relatively predictable. It is known in advance of the auction and will likely retain a similar construction from one auction to the next (anchored by the 3 hours target LOLE and price cap). So the key uncertainty and complexity driving capacity pricing, comes from the cost structure and bidding behaviour of the market participants that make up the capacity supply curve.
Structure of the capacity supply curve
In order to understand capacity price levels it is important to have a grasp of the cost of providing incremental flexible capacity. To the extent that the Capacity Market is competitive, pricing should broadly reflect the cost of providing incremental capacity (caveat the reality that there may be significant opportunities to exercise market power in setting market price).
There are a number of potential sources of incremental capacity, but the key ones likely to drive capacity pricing can be grouped as follows:
- Preventing existing gas & coal plant from closing
- Refurbishing existing gas & coal plant to enhance/extend lives
- Developing new OCGT or CCGT plant
Deriving the cost structure of the incremental sources of capacity is not simple. The relevant benchmark for each source is the cost of capacity net of energy market returns (i.e. net of margin earned in wholesale power market). But as plant owners bid into the auction this year, they will need to make an assumption on the impact of the Capacity Market on power prices and implied energy market returns in 2018/19. Views on this may vary significantly.
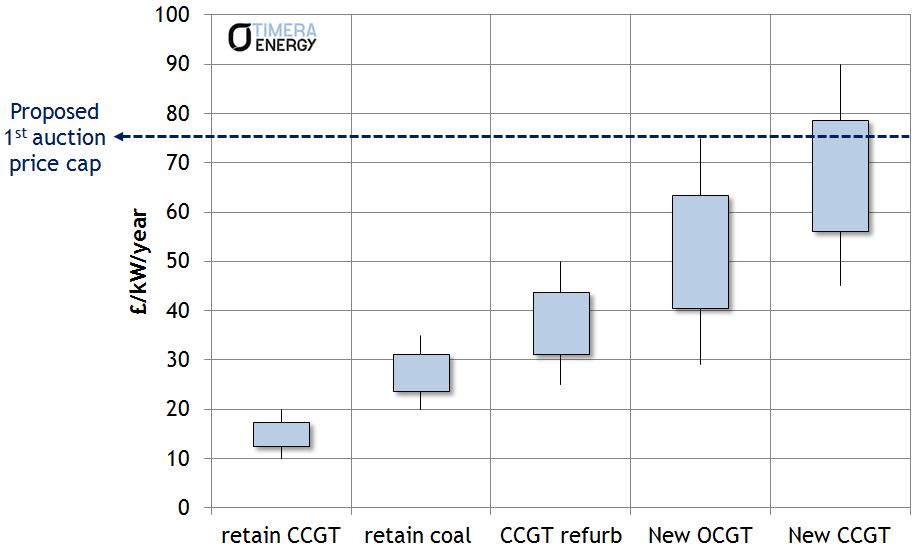
In Chart 2 we show some estimated ranges of incremental capacity cost by source. The ranges around each category reflect two factors. Firstly, different cost estimates depending on asset/technology. But secondly and more importantly, uncertainty around how plant owners will net off anticipated energy market returns when bidding into the Capacity Market.
Plant across all of these categories will compete to provide capacity, but the key question is which category will represent the marginal (price setting) source. These plants will have the greatest influence in determining capacity price, as well as the greatest ability to exercise market power.
What type of plant will set the capacity price?
In order to understand which category of plant will set capacity prices it is important to understand how much incremental capacity will be required to meet the DECC target. Of foremost importance is a snapshot of the projected capacity requirement, 4 years in advance of delivery. This is because the main 4 year-ahead capacity auctions (e.g. in 2014) will be driven by the government’s forward estimates of capacity requirement (e.g. in 2018/19). The capacity price will then be set in the auction based on the available capacity options to meet the target.
So considering the dynamics across the 3 main capacity categories:
Retaining existing plant
Paying existing CCGT and coal assets to remain in service requires at a minimum that plant fixed costs are covered. So in a situation of capacity oversupply, plant fixed costs will be an important benchmark because the capacity price is likely to fall below these levels until older plants retire to redress the capacity balance.
Given the current conditions of capacity tightness in the UK, oversupply is unlikely to be an issue this decade. But paying existing plant to remain open may have a key influence on the first capacity auction in November. This is because DECC may allow loss making plant (e.g. many of the 90s built CCGT assets) to include in their capacity market bids, the losses suffered over the 4 year period prior to capacity delivery (i.e. 2014-18). This may significantly inflate the cost structure around existing plant in the first auction (although this will be a one-off effect).
Plant refurbishment
As well as just delaying retirement, owners of existing CCGT assets can also make a more substantial investment in upgrading the plant. DECC has indicated such refurbishment must involve investment over and above normal major maintenance capex (e.g. gas turbine refurbishment, CCGT to OCGT conversion or coal supercritical conversion).
The advantages of refurbishment for the owner are not just the enhanced asset, but the ability to lock in a capacity price over a longer duration contract (at least 3 years, maybe 5). It also allows the asset owner ‘price setter’ rights in the auction. Refurbishment may prove to be a fruitful source of incremental capacity. This may act as an important buffer to prevent capacity prices from rising to support new build OCGT/CCGT capacity.
New build plant
DECC has, somewhat controversially, proposed to base the price cap on the cost of a large modern OCGT plant rather than the traditional market benchmark of a new CCGT plant. DECC has published a gross cost estimate for an OCGT of 47 £/kW/yr, implying a net cost of 29 £/kW/yr (based on their courageous assumption of 18 £/kW/yr of OCGT energy margin).
This comes in substantially below DECC’s net cost estimates for a new CCGT which range up to 60 £/kW/yr. While in theory, if it is only capacity that DECC wants to deliver, it may be logical to structure capacity pricing around OCGT assets. But in practice OCGT investment has been ‘off the table’ for most UK market participants given the more favourable all in economics of CCGT assets.
The key interaction determining the cost of OCGT versus CCGT plant comes down to assumed energy market returns. Because a new CCGT is significantly more efficient than an OCGT, it will earn higher energy market returns to offset its higher capital costs. In fact it is difficult for an OCGT plant to earn any significant energy market returns in the UK given they must compete against a large volume of existing CCGT and coal assets, most of which are likely to have a variable cost advantage.
The first auction will reveal to what extent new OCGT actually play a role in setting capacity prices. But OCGT aside, there are a raft of potential new CCGT projects that will act to constrain upwards movement in capacity prices.
Marginal capacity pricing dynamics
The level of UK capacity prices will largely be determined by which of the three categories of plant sets the price. Given current capacity tightness, the market is likely to clear significantly above the fixed costs of CCGT (10-20 £/kW/yr). In other words existing CCGT plant are set to earn substantial margins in the CM.
But in our view it is unlikely that capacity prices in the first auction will rise to levels that support OCGT/CCGT new entry (e.g. 60+ £/kW/yr). That is unless the government sets a very aggressive capacity target and/or disadvantages existing coal plant (causing it to retire early). Instead there looks to be a fairly comprehensive range of plant life extension/enhancement options that can bring forward the incremental capacity required. The capacity supply curve is however likely to be lumpy which may mean sub-groupings of plant have considerable opportunities to exercise market power in setting price (e.g. by bidding up towards a level that supports OCGT/CCGT new entry).
Whichever category of plant sets marginal capacity pricing in November, capacity is likely to price at a level that places downward pressure on wholesale power prices in 2018/19. In other words UK power market returns are going to undergo a rapid and structural change. We consider the implications of this for portfolio managers and asset investors in our next and final article in this series.
We offer bespoke workshops on the commercial implications of the Capacity Market. These can be tailored to address issues such as business impact, asset strategy and market pricing dynamics. If you are interested please
contact us.


