European and Asian gas markets are dominated by long term oil indexed pipeline and LNG supply contracts. The pricing of these supply contracts is a key driver of spot and forward market price dynamics. But because these contracts are highly commercially sensitive, publicly available contract price data is hard to come by. This is a particular problem for price benchmarks over a forward horizon. A common approach to filling this gap is to develop a proxy for the evolution of prices based on observable market price data for traded products.
Uses of proxy curves
There are many uses for proxy curves but these can broadly be grouped into two areas.
- Forecasting future price benchmarks for price series that are not directly observable:
- Understanding the future pricing of flexible supply contract volumes which are a key driver of marginal market pricing. For example, Russian supply contract prices are a key driver of the evolution of European spot and forward hub price dynamics. So a Russian supply contract price proxy can be used to analyse hub price behaviour.
- Forecasting and valuing indexed contract prices which have components that have no directly observable forward curves (i.e. developing a proxy for the index components). For example, some gas contracts formulas include oil product indices published government departments which have no forward prices available. A proxy for these indices can be used to forecast contract price, facilitating valuation of the contract.
- Analysing the implied exposures that influence a price series:
- Analysing the evolution of contract pricing influences. For example, it is possible to derive the evolution of the Asian LNG “S-Curve” slope or level against crude over time.
- Analysing and hedging implied exposures arising from contract indexation to non-standard prices. For example, the early Ruhrgas release gas auctions in the late 2000’s had the option to index to the Average German Import Price (AGIP) published by the German ministry. Developing a proxy for AGIP allowed the implied fuel oil and gas oil exposures to be calculated and hedged.
Methodology for developing proxy curves
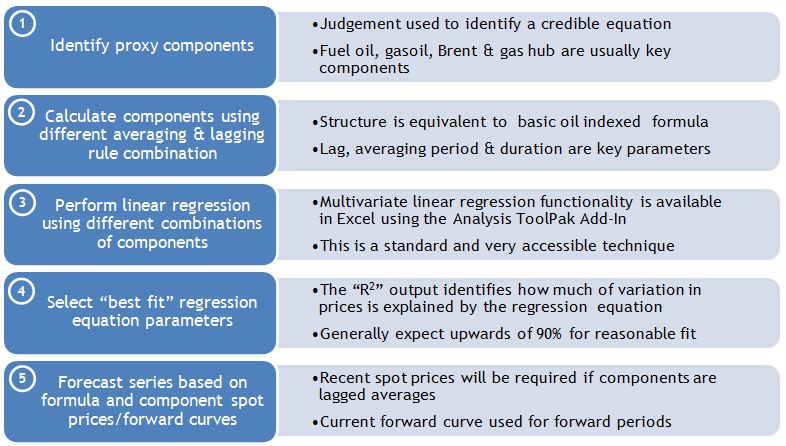
The basic methodology involves developing a formula that allows the future values of a price series to be modeled as a function of price variables with transparent forward price data. A regression approach is typically used to identify the best fit linear equation against variables with different combinations of lagging and averaging rules. The basic linear equation is given below:
proxy pricet = a + b × component price1 (x1, y1, z1) + c × component price2 (x2, y2, z2) + …
where:
a is the intercept (equivalent to fixed price element of the formula)
b, c are slope coefficients that define the influence (or exposure) of each component
(x, y, z) are the averaging rules of each component (lag, averaging periods, duration)
The regression allows the values for the constants (a, b and c) to be calculated but the different combinations of price component averaging are pre-calculated. Other more complex (e.g. non-linear) relationships are also used but are less common. The attraction of using a linear relationship is that it mirrors the structure of most contracts and linear regression is a relatively simple and accessible technique. The basic methodology is outlined in the diagram below.