There is a rapidly growing requirement for new power flexibility to support the European energy market transition. We published a briefing pack ‘The flexibility to decarbonise’ in Q1 2020 which showed over 30GW of flexible capacity retirements across Europe’s larger power markets by 2023, with 60GW due to disappear by 2030.
“Battery asset optionality is complex (like hydro storage)..
…if you don’t confront that complexity, it is unreasonable to expect you will get your money back.”
The energy deficit caused by coal, nuclear & gas plant closures is being addressed by the development of new renewable capacity. But wind & solar does not help with the rapidly increasing flexibility deficit across European power markets. This is where batteries are set to play an important role, as the primary scalable source of low carbon flexibility.
While the fundamental market logic supporting investment in energy storage is clear, quantifying realistic battery returns is a more complex challenge. And the development of a viable battery investment case requires valuation numbers that are both transparent and understandable.
In today’s article we set out 5 challenges in valuing battery assets and ‘open the hood’ on the methodology we use to quantify battery margin.
Battery valuation: 5 key challenges
Batteries may feel like a cutting-edge new asset class. But energy storage assets have been around for decades. The valuation & monetisation techniques being deployed by established battery operators (e.g. EDF, Statkraft, Centrica) are closely related to those already in use for other types of storage e.g. hydro and fast cycle gas storage assets.
Batteries have their own unique characteristics e.g. fast cycling speed and degradation. But the biggest threats to realistic battery valuation are shortcuts and oversimplification. Two examples of flawed approaches to modelling battery value are:
- Trying to use a generation supply stack model to analyse battery margins
- Calculating battery margin based on an empirical relationship to a market volatility index.
These approaches may be convenient to execute and explain, but they are the analytical equivalent of making up numbers.
Battery asset optionality is complex (like hydro storage). If you don’t confront that complexity, it is unreasonable to expect you will get your money back.
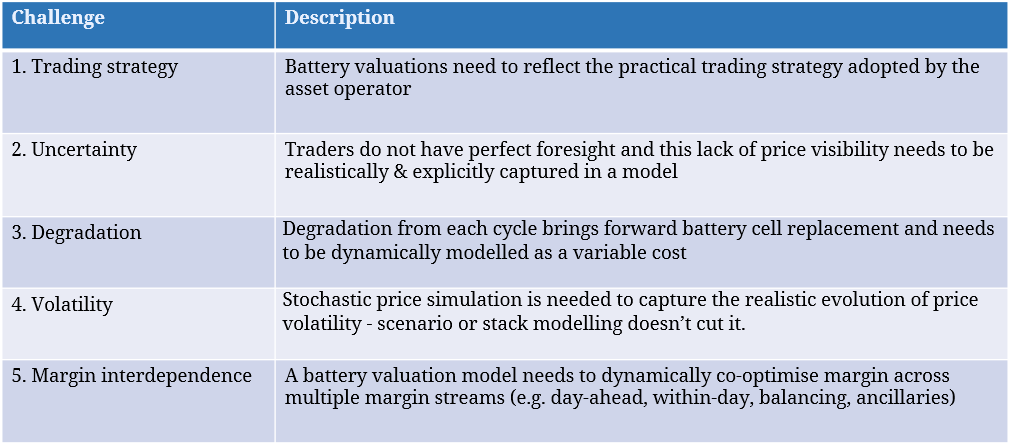
In Table 1 we summarise five key challenges in quantifying battery value that are often glossed over.
1.Trading strategy
At its most basic, battery optimisation can appear simple. Batteries charge during periods of low-power prices and discharge when prices are high. With the help of ‘perfect foresight’, an optimal battery dispatch strategy can be back tested against historical power prices. This typically shows the battery charging overnight and discharging across peak periods, albeit with many cycling fluctuations to respond to price volatility.
Realistic battery valuation, however, requires modelling of both (i) battery dispatch and (ii) the trading strategy adopted by the battery operator. Traders face a complex decision-making process of how to monetise the battery across frequency response, day-ahead, within-day and balancing prices. A battery valuation model needs to explicitly capture this decision-making process, otherwise modelled value is purely theoretical.
2.Uncertainty
Batteries differ from most other peaking assets in that optimisation has two legs: a charge and a discharge. The traders operating the battery do not have the benefit of perfect foresight and face limited within-day market liquidity. As a result, traders often need to trade one leg of a price spread (e.g. charge) before knowing the final price of the second leg (e.g. discharge).
This price uncertainty that traders face in monetising the battery, impacts both the level and variability of margin captured. So price uncertainty needs to be explicitly modelled and reflected in the trading & dispatch decision making process.
3.Degradation
Each time a battery cycles, it degrades cell life and brings forward the timing of battery replacement. This means that there is effectively a variable cost of cycling the battery which needs to be explicitly captured when modelling value.
Each cycle needs to be valued to ensure sufficient margin is earned to both pay off capital investment and make a return. This minimum margin is referred to as a ‘shadow cycle cost’ and is dependent on degradation rates along with battery cell costs. As battery cell costs are projected to fall, future cycle costs will fall, increasing battery cycle rate.
4.Price volatility
The primary driver of battery value is its flexibility to respond to price volatility. So realistic modelling of the evolution of price volatility dynamics is key to a robust valuation. A stochastic (e.g. Monte-Carlo) price simulation engine is required to:
- Generate multiple (e.g. 500+) hourly price paths over the life of the battery
- Capture a realistic relationship between the volatility & correlation of day-ahead, within-day and balancing prices
- Capture the evolution of these pricing dynamics as market fundamentals change over time e.g. wind & solar increases, thermal capacity closes, battery volumes increase & demand shape changes.
Simple scenario-based modelling or the standalone use of supply stack models will not create realistic distributions of market prices or battery energy margins.
5.Margin interdependence
A robust battery investment case is built on a viable margin stack e.g. covering wholesale, balancing, ancillary, network charge avoidance and capacity returns. The different components of this margin stack are typically co-dependent. For example, selling capacity into a frequency response or day-ahead markets, constrains value capture in the balancing market.
These interactions between different margin streams need to be explicitly captured in a battery valuation model. The model should dynamically co-optimise across margin streams, considering opportunity cost, a lack of perfect foresight and the impact of cycling on degradation.
How we model battery value
At Timera, we model battery value using an in-house stochastic optimisation model which uses a methodology consistent with that deployed by established battery operators. This model draws on many years of experience across our team of hydro & fast cycle gas storage margin modelling.
The ‘engine room’ at the core of the model is:
- A Monte-Carlo price simulation module that generates multiple correlated distributions of prices across frequency, day-ahead, within-day & balancing markets
- A storage optimisation algorithm that quantifies margin capture across each simulated price path, capturing the trader decision making process
The key outputs of the model include distributions of energy margins (e.g. P50, P10, P90) as well as cycling & degradation information. To ensure realistic returns, we explicitly define a trading strategy and mirror the decision-making process of the battery operator at all stages. This reflects the lack of perfect foresight and the price uncertainty in each stage of battery optimisation.
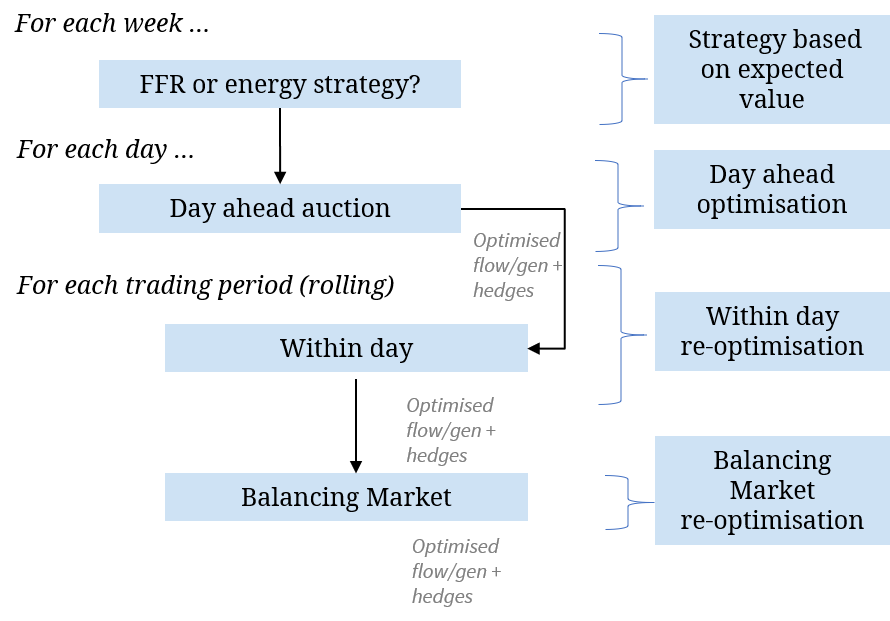
Diagram 1 shows the steps of battery margin optimisation into a given dispatch period. At the week ahead or month ahead stage the operator may need to decide whether to commit the battery to provide ancillary services e.g. frequency response.
Then there are further key decision points at the day-ahead, within-day and balancing market stages.
The battery is first optimised against day-ahead power prices, replicating day-ahead power auctions. Every cycle in the optimisation process is fully costed to capture degradation, use of system costs, losses, and other variable charges. Rather than simply ‘locking in’ all the value at the day ahead stage, an ‘imperfect foresight’ forecast of within-day and balancing prices is also made to measure the opportunity cost.
Following the day-ahead optimisation, the battery is then re-optimised on an hourly rolling intrinsic basis against the actual known within-day spot prices and a forecast of available balancing prices. Then the battery is optimised against balancing prices and re-hedged against within-day prices to ensure the battery can meet its previously contracted position.
Finally, the whole process is repeated several hundred times, with the modelled battery optimised against different simulated price paths to create a full energy margin distribution, reflecting realised battery returns.
Importantly, the model provides transparent information on how battery margin is being captured and the variability (or distribution) of the margin stack.
Margin distributions not forecasts
A battery project investment case is built on margin distributions not margin forecasts. The margin distribution quantifies the risk/return profile of the battery.
Whilst the expected (P50) level of margin is a key valuation benchmark, the shape of the margin distribution (e.g. P10 & P90) is just as important in quantifying how margin may deviate given uncertain market conditions.
Quantifying realistic battery margin distributions requires the dynamic modelling of price volatility, trading strategy, degradation, and margin stack co-dependence as we set out above. This is not a ‘black box’ approach, it is a source of valuation transparency with a direct relationship to how the battery is operated in reality.
The most common question asked by battery investors is a very reasonable one: ‘how can I get comfortable with margin downside?’. The answer is to robustly quantify, challenge & benchmark the left-hand tail of the asset’s margin distribution. As hydro asset owners know well, there are no shortcuts.