Investment in gas storage, like most energy asset classes, has strong cyclical dynamics. Storage cycles are reinforced by relatively long project construction lead times. It can take 3 to 5 years to bring capacity online after making an investment decision, by which time market conditions can have shifted from ‘boom’ to ‘bust’.
The UK gas market (along with other European markets) saw a storage investment ‘boom’ later last decade. This was driven by robust levels of seasonal price spreads and spot price volatility, the two key price signals for storage investment. As a result, relatively large volumes of new storage capacity were commissioned earlier this decade.
This ‘boom’ quite quickly transitioned to ‘bust’. Gas demand across Europe fell by almost 20% from 2010-15, reducing the demand for supply flexibility. On the supply side, new storage capacity contributed to an emerging overhang of flexibility. Seasonal price spreads and spot volatility declined accordingly, creating a tough margin environment for storage across most of this decade.
But this prolonged bust has sown the seeds for the next boom in UK storage. Price signals for supply flexibility in the UK gas market are signalling a tightening market. Both seasonal price spreads and prompt volatility are continuing a structural recovery that started in 2016.
In today’s article we analyse the evolution of UK gas storage margins and set out how and why they have surged across the last two years.
Structural drivers behind UK gas flex recovery
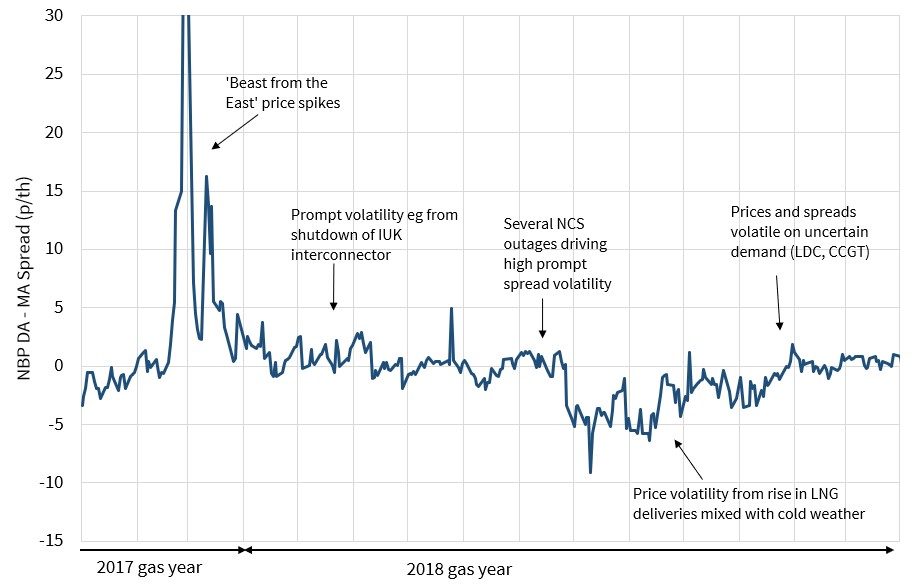
The most important driver of the recovery in the value of UK gas supply flexibility has been the closure of Centrica’s Rough storage asset. Rough accounted for more than 70% of UK working gas volume and 25% of daily deliverability. Its closure upended the UK supply and demand balance for flexibility.
The impact of Rough’s closure has been reinforced by the roll off of long term contracts (with low variable flow costs) on the IUK interconnector in Q4 2018. This has transitioned the IUK to a higher variable cost peaking provider of flexibility. Ebbs and flows in LNG imports across the last two years are also supporting higher NBP price volatility.
Looking forward over the next 5 years, market conditions do not look conducive to another bust. There are 3 important structural drivers that support a continuing recovery in the value of gas supply flexibility:
- Increasing import dependency: as domestic production declines, the UK and European gas markets are becoming more dependent on import supply chains which are slower to respond to price signals (supporting price volatility)
- Greater power sector flex requirement: rapid growth in intermittent renewable capacity and the closure of coal-fired plants is increasing the requirement for flexibility from gas-fired generators
- Ageing infrastructure: Rough is illustrative of ageing gas supply infrastructure across the UK & Europe, with owners reticent to invest in (or even maintain) assets given low margins experienced this decade.
Salt cavern fast cycle storage is the asset class best positioned to respond to recovering market price signals. Margins of existing assets have seen a significant recovery since 2016 (as set out in the section below). Across the last two years, there has also been a strong increase in interest from gas suppliers and traders looking to secure fast cycle storage contracts or offtake agreements.
Analysing UK storage margin evolution
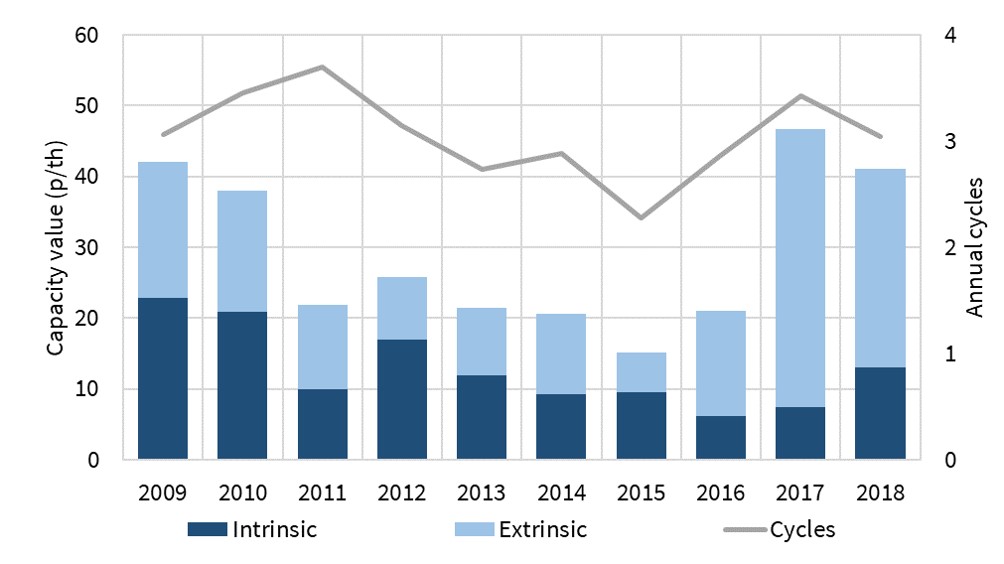
In order to understand the evolution of UK faster cycle storage value we have modelled historical margin capture for a storage asset with the capability to cycle ~6 times per year (30 days injection, 30 days withdrawal).
This analysis does not involve ‘black box’ storage modelling. It is based on a transparent & objective ‘rolling intrinsic’ margin capture strategy that could have been achieved against historical NBP forward curves. In other words analysis does not involve any unrealistic assumptions such as inflated extrinsic value capture or perfect foresight.
Chart 1 shows annual achieved margin capture for each gas storage year (starting Apr, ending Mar) from 2009 to 2018. We calculate storage margin capture by:
- Taking daily NBP gas forward curves across the horizon (bootstrapped settlement prices)
- On each day, identifying & executing any profitable hedges & hedge adjustments against observable forward prices (accounting for variable cycling costs & BO spreads)
- Injecting & withdrawing gas based on final hedge positions
- Calculating the annual captured margin as the sum of hedge cashflows minus variable costs across each storage year.