Two key capacity auctions are approaching in Q1 2020 that will shape the UK power market capacity mix into the mid 2020s. 12-14 GW of incremental flexible capacity may be required by 2025 as the UK coal fleet is decommissioned and older CCGTs retire. This requirement is over and above high volumes of wind and solar build.
Competition to deliver this capacity will focus on 5 key capacity types: batteries, engines, new CCGTs, existing CCGTs and interconnectors. Demand Side Response (DSR) will also play an important role, although we have intentionally excluded DSR from this list for reasons we explain below.
Timera has extensive experience of flexible asset valuation to support asset owners and investors. In today’s article we draw on this to do a ‘head to head’ comparison of these 5 capacity types. For each type, we set out £/kW revenue stacks, value drivers and key risks.
Although our focus today is on the investment case for flexible assets in the UK market, the value & risk breakdown we show is more broadly relevant across all European power markets.
Revenue stacks: the ‘big 5’ go head to head
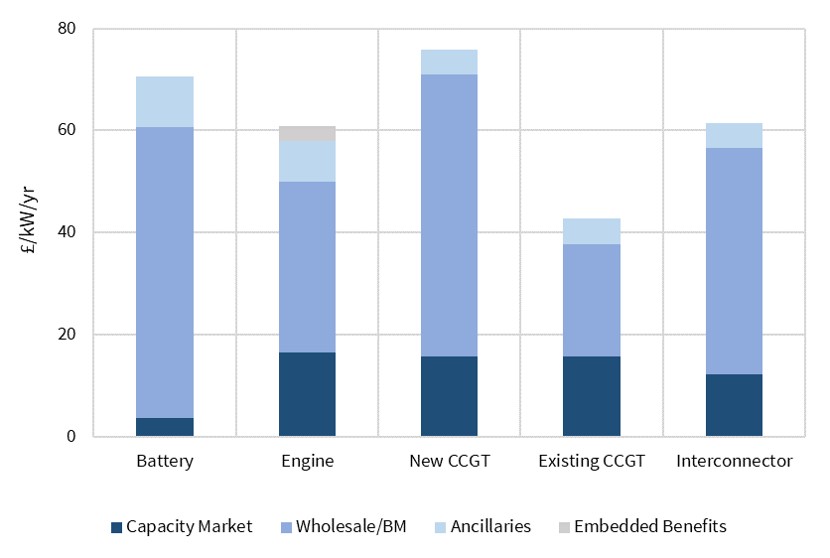
We compare the 5 capacity types by estimating the annual average revenue required to earn a return on capital (in £/kW), as shown in Chart 1.
Estimation involves the following steps:
- Capital recovery: Take base assumptions on project capex, opex, economic life & cost of capital (informed by investment work we have done across all these asset types).
- Capacity revenue: Overlay assumption of an average 17 £/kW capacity market clearing price (simple average of first 4 T-4 auctions).
- Supplementary revenue: Overlay average ‘generic asset’ revenue assumptions on ancillary & embedded benefit revenue streams by asset type (e.g. covering frequency response, fast reserve, STOR).
- Wholesale/BM revenue: Back out the residual revenue required from the wholesale market and balancing mechanism, in order to cover required return on capital.
The reason we use this approach is that it provides a relatively objective view of “revenue you need to believe in, to invest in the asset class”. The numbers do not reflect Timera’s forecast of future revenues by asset class (which would clearly be a more subjective exercise).
It is important to interpret the chart correctly. The levels of required annual revenue are not a direct measure of competitiveness, but rather of required cost recovery.
For example, a new build CCGT has a substantially higher capital recovery requirement than an existing CCGT. But it also has a clear revenue advantage given higher plant efficiency.
Competitiveness across asset types comes down to a combination of capital recovery and ability to generate revenue. The competitive question can be framed as ‘is it tougher to monetise 57 £/kW of wholesale & BM revenue from a battery, than 33 £/kW from a gas engine… or 44 £/kW from an interconnector’ ?
What about DSR?
DSR has been very successful in previous UK capacity auctions. However it has predominantly been sourced by aggregators in the form of small scale backup or behind the meter generation (as well as some industrial process flex). The main revenue source for DSR (aside from capacity payments) has been payments from suppliers to avoid system charges.
There are two reasons why we have not included DSR as one of the flex categories in the chart.
Firstly, there have been significant changes to the policy landscape over the last two years that adversely impact DSR. Our view is that DSR is going to be less competitive in Q1 2020 compared to previous auctions. This is because of a loss of core revenues as a result of the Transmission Charging Review (TCR) and removal of triad benefits. But that is not a reason in itself to exclude DSR from the chart.
That is more focused on the second reason, which is that it is difficult to define generic DSR project economics. DSR projects are typically comprised of a site specific combination of different sources of flex (e.g. behind the meter generators and industrial process flex). Trying to illustrate generic returns, as required for chart, oversimplifies DSR economics.
We anticipate DSR will play an important role going forward but new policy & technology platform developments are required to unlock value as we cover in our article on weaponising the demand side.
Focusing in on wholesale & BM revenue
Chart 1 highlights the focus on required wholesale & BM returns to make an adequate return. Those returns can be broken down into revenues linked to:
- Price levels – the structural or intrinsic level of prices or spreads e.g. spark spread levels for gas plant and cross border price spread levels for interconnectors (UK vs FR/BE/NL/NO/DE)
- Price shape – hourly intraday prices shape
- Price volatility – fluctuations in spot & balancing mechanism prices (e.g. due to load / wind / solar).
The revenue split across these three categories varies significantly by capacity type as illustrated in Chart 2. This breakdown of wholesale & BM revenue source is a key driver of project risk (which in turn drives cost of capital). The numbers behind Chart 2 again draw on detailed analysis we have done across a range of flexible assets.
Exposure to price level (e.g. spark spreads or cross border spreads) can be hedged in the forward market. Capture of price shape is focused on the prompt horizon ahead of delivery e.g. via the day-ahead auction. Capturing revenue from volatility involves more dynamic optimisation of asset flexibility against spot and BM prices.
The greater the focus of revenue on price shape & volatility, the more important is a strong trading and optimisation capability, either ‘in-house’ or outsourced to a third party.
All of these considerations have an important practical impact on valuing assets and projecting revenues. There was quite a bit of ‘theoretical modelling’ of flexible asset value to support capacity bids (& asset acquisitions) in the lead up to the last capacity auction. This approach tends to result in ‘theoretical revenues’, as a number of gas engine & battery investors have painfully discovered over the last two years.
Value drivers and risks across capacity types
We finish by providing a summary of the key value drivers and risks across the 5 capacity types.
In the capacity auctions held to date, volumes of new build have been limited by older coal and CCGT plants bidding in a relatively competitive way. DSR and engines have taken the lions share of new capacity agreements awarded.
There is an increasing chance that both these dynamics change in Q1 2020. As we have set out across the last two weeks, DSR & engine projects are likely to bid at significantly higher capacity price levels, given revenue erosion since 2018. Coal units are also suffering from low gas prices and rising carbon prices.
These dynamics appear to have leveled the competitive playing field across the 5 key capacity types. But the Q1 auction results will be the best judge of how the ‘big 5’ face off in battle.
Briefing pack: UK power
Nov 2019 Timera briefing pack focused on UK capacity balance, power price dynamics and investment in flexible assets. Follow link here for PDF document Back in play |