The LNG market is adjusting to the new reality of regional price convergence. Soft Asian demand, new liquefaction capacity and lower oil-indexed contract prices are all contributing to compress regional price differentials. Under these conditions, LNG shipping costs are playing an increasingly important role in determining LNG flows and spot pricing dynamics.
Quantifying the fall in shipping costs
We recently published an article on the rapid decline in LNG vessel charter rates over the last three years. This fall in charter rates has significantly reduced relative incremental shipping costs between delivering gas to Asia versus Europe. In other words, the ‘strike price’ for diverting LNG from Europe to Asia has fallen. This effect has been reinforced by a fall in bunker fuel prices as the oil market has weakened.
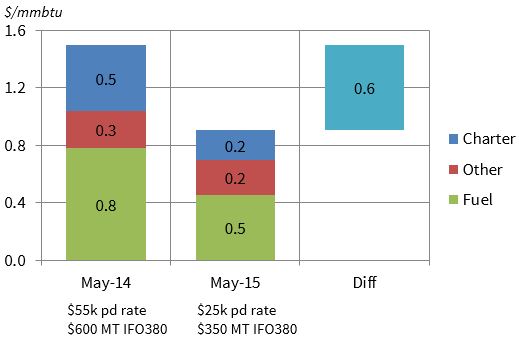
Chart 1 illustrates an example of the reduction in LNG shipping costs over the last 12 months (from May 2014 to May 2015). It focuses on the cost of diversion of a cargo located at a Spanish terminal (Huelva) to Japan (Sakai).
Assumptions 147k MT vessel. 19 knots average speed. 10014 NM journey via Suez. Laden leg only. USD 400k canal transit charge (one way) + other costs including port fees, brokerage and insurance.
The chart illustrates how the different components of shipping cost have contributed to the overall reduction in laden voyage direct costs. The key factors driving the 0.6 $/mmbtu decline in shipping cost over the last year have been:
- A ~55% reduction in spot charter rates from $55k to $25k per day
- A ~40% reduction in fuel oil costs from 600 to 300 $/mt (IFO380 benchmark)
The days of the structural diversion of LNG from Europe to Asia are gone. Cost reduction of cargo diversion to Asia, combined with much tighter regional spot price differentials, means LNG spot market flows and pricing are becoming much more dynamic.
The importance of shipping costs in driving LNG price spreads
LNG shipping costs are an important driver of the way LNG trading desks optimise cargoes. But they also have a broader impact in determining how LNG volumes flow between regions and how regional LNG spot prices are determined.
Since summer 2014, Asian spot LNG prices have remained within a tight range of European hub prices. The practical mechanism which is driving this convergence is the optimisation of flexible cargoes between the two regions. And shipping costs play a key role in driving this as we set out above.
In order to understand how regional spot price differentials are driven, it useful to think of different tranches of flexible supply with diversion decisions influenced by relative shipping costs, for example:
- Reload and diversion of a European cargo to Asia
- Diversion of an Atlantic basin sourced cargo to Asia versus Europe
- Qatari decision to sell spot cargo into Asia or Europe
The spot price premium required to attract cargoes to Asia (from Europe) falls across these three tranches. This is illustrated in Table 1 which shows shipping cost differential examples for Tranches 1 to 3 (with two examples shown for Atlantic Basin diversion Tranche 2: Trinidad and Nigeria).
When interpreting the numbers in the table, it is important to note that they reflect direct costs for a laden only voyage (i.e. do not allocate a cost for the return voyage). In our view this is the most transparent and objective way to assess differentials. But in practice there can be significant cost and risk premiums over and above the direct costs of cargo diversion. This can add upwards of 0.5 $/mmbtu to the spread required for companies to exercise a diversion option. An overview of the calculation of shipping costs and premiums can be found here.
The table illustrates how different sources of flexible LNG supply to Asia are ‘choked off’ as regional price spreads decline. European reloads are the most expensive source of diverted LNG and are therefore the first to go. There has been clear evidence of this over the last 12 months as European reload volumes have virtually dried up as the Asian price premium has collapsed.
Diversion costs then decline based on the incremental distance to ship cargoes to Asia (e.g. Trinidad higher than Nigeria). Qatar plays a key role at the centre of the LNG market, with its location meaning that producers are largely indifferent on a shipping cost basis as to whether cargoes are sent to Europe or Asia. At the point where Asian spot prices fall below NBP (as was the case earlier this year), the incentives to flow flexible LNG to Asia disappear altogether.
Current LNG spot price dynamics
Asian spot LNG prices are currently around 7.30 $/mmbtu. This compares to UK NBP prices at around 6.70 $/mmbtu. Asian spot prices have settled at a small premium above NBP over the last couple of months, although the current spot market is characterised by a lack of liquidity. With Japanese and Korean importers well contracted and carrying high inventories, spot trade has been dominated by opportunistic buying of cargoes in a 7.00-7.50 $/mmbtu price range (e.g. from China and India).
Spot market liquidity is set to increase over the next two years as new liquefaction capacity comes online. This is particularly true of destination flexible supply (e.g. US export capacity) that will flow to the highest netback spot price. But the spot price dynamics that have evolved in 2015 are representative of what can be expected going forward in a world of price convergence.
The LNG spot market will remain anchored by European hub prices. Asian spot prices will typically trade within a reasonably tight range of European hubs, although there may be volatility in regional spot prices at any point in time, reflecting shorter term fluctuations in supply and demand. Under these conditions, shipping costs are set to play an increasingly important role in driving flexible LNG cargo flows and spot pricing dynamics.
This article was written by David Stokes & Olly Spinks.


