The LNG market has kicked off 2021 by smashing records. An acute shortage of cargoes in Asia across Jan & Feb has seen cargoes transacting near 40 $/mmbtu and spot charter rates surging to 350k $/day. These extreme price dynamics come less than 9 months after record low prices.
“Dynamics this winter are consistent with a ‘regime shift’ taking place in the LNG market…
…with important implications for LNG asset value and global gas & power prices”
So far surging prices have been contained within the current winter horizon and started to ease late last week. JKM forward prices are in steep backwardation, with prices back under 7 $/mmbtu by April. But explosive price dynamics this winter are consistent with an important ‘regime shift’ taking place in the LNG market.
The supply & demand balance over the next 5 years is set to significantly tighten versus the 5 years we have just experienced. And that will have some important implications for LNG asset value as well as for European gas & power prices.
What we have become used to: 2016 – 2020
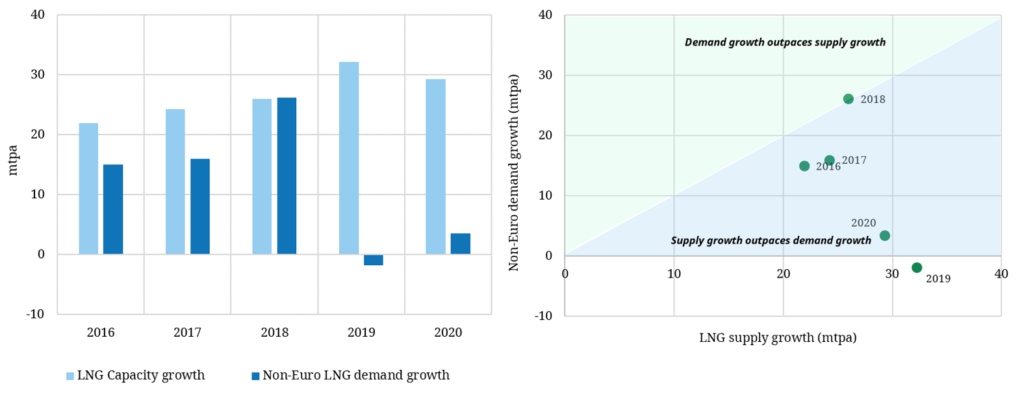
Across the last five years, the LNG market has been driven by a ‘well supplied regime’ characterised by net supply growth. Increases in global supply capacity have outpaced demand growth across Asia, MENA and Latin America. Surplus supply has been absorbed by Europe in its balancing role as swing provider to the LNG market (and in the more extreme conditions of 2020 by US export shut ins).
These conditions are illustrated in Chart 1 which shows annual growth in global liquefaction capacity (supply) versus growth in Non-European demand (from Asia, MENA & Latam). The left hand panel shows a simple annual time series. The right hand chart plots this data as dots on a scatter plot. Dots that sit below the diagonal line in the blue shaded region, represent conditions of net supply growth.
The extent of net supply growth (i.e. how deep a year lies into the blue shaded region) has an important influence on market pricing dynamics. For example pronounced net supply growth in 2020 saw low prices compared to a more balanced market in 2018.
The ‘well supplied regime’ that has prevailed across the last 5 years is typically characterised by:
- Lower absolute price levels
- Lower inter-regional price spreads (e.g. JKM vs TTF), with higher correlations
- Lower volatility of price spreads
- Higher LNG imports into Europe, with strong JKM / TTF relationship
- Lower vessel charter rates
- Stronger influence of Henry Hub prices (given US shut in dynamics)
As of 2021, this regime that we have become used to is set to change.
What lies ahead: 2021 – 2025
The global LNG market is transitioning this year into a period of what is likely to be at least 4 years of a new ‘tighter market regime’. This is characterised by net demand growth (vs net supply growth in a well supplied regime).
There is a 4 to 5 year lead time between FID of a new LNG supply project and it coming online. This means we can be reasonably confident as to what supply growth will look like over the next 5 years. Uncertainty is much greater when it comes to demand growth, particularly in higher growth Asian countries (e.g. China & India) which have been the engine room of LNG market growth.
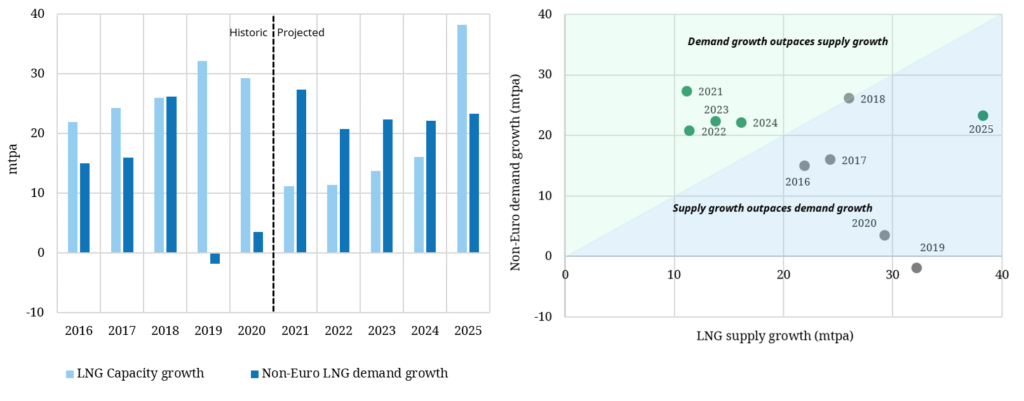
Chart 2 illustrates a scenario for the evolution of LNG market supply & demand growth over the next 5 years. The scenarios assumes 2021 is a relatively strong year of demand growth given post Covid economic reopening, very strong global fiscal stimulus tailwinds and some pent up demand from 2020. Demand growth then returns to levels consistent with e.g. the 2016 – 18 period. On the supply side the scenario assumes currently FID’d capacity comes to market (including new Qatari trains ramping up in 2025).
The transition to a ‘tighter market regime’ is clearly illustrated by the dots across 2021–24 sitting in the green shaded area above the diagonal. In other words the LNG market is transitioning to a state of net demand growth.
This ‘tighter market regime’ is characterised by very different conditions to what we are used to from the last 5 years:
- Higher absolute price levels
- Higher & more seasonal inter-regional price spreads (e.g. JKM vs TTF), with lower correlations
- Higher volatility of price spreads & greater frequency of price spikes (e.g. Jan 2021)
- Lower LNG imports into Europe, with Asia pulling gas away
- Higher vessel charter rates (longer average voyages)
- Reduced influence of Henry Hub prices as TTF/JKM diverge
These conditions are very supportive of the value of flexible supply portfolios that are long optionality. At the same time they represent rising risks in servicing customer portfolios & sales contracts and managing exposures on any sold optionality. The regime shift also points to rising gas & power prices in Europe as LNG import flows decline.
The dynamics playing out in the LNG market this winter are just a taste of what may be to come. LNG supply is relatively inelastic (price insensitive), particularly within short term delivery horizons (e.g. 2 – 3 months) given the impact of supply chain and logistical constraints. The impacts of inelastic supply are likely to become more frequent and more pronounced as the market tightens across 2021 – 24.
Analysing LNG prices and their impact on asset value
The future of markets is inherently uncertain. Anyone who believes they can accurately forecast market outcomes only needs to look back at the events of the last 3 years (tight market Summer 2018 to crash in Summer 2020) before swallowing their hubris.
Does it make sense to base a view of the future on market forward curves? Not really. Forward prices are key for managing and marking to market portfolio exposures. But they do not represent an accurate prediction of price evolution, given:
This presents LNG businesses with a major challenge. In order to create portfolio value and manage risk, it is important to understand the impact of a range of potential spot & forward price outcomes. For example, how do the individual components of an LNG portfolio interact to drive value in conditions of extreme price volatility, surging charter rates and the breakdown of price correlations.
This challenge is best tackled via a robust price simulation engine, that captures the specific characteristics of the market regime dynamics we set out above. Let’s take a case study of how we have tackled this in our analytical toolkit.
Our framework for LNG market price simulation has been developed around the Timera LNG Bridge model. This is a portfolio valuation model that we have implemented & used across a range of large LNG companies (e.g. oil & gas majors, commodity traders, producers & utilities). The model simulates market prices, optimises portfolio flexibility (e.g. cargoes, contracts, hedges) and generates asset & portfolio value distributions to support originators, traders, risk managers and asset investment decisions.
The pricing engine in LNG Bridge produces multiple (e.g. 500+) correlated spot & forward price simulations at different locations (e.g. JKM, TTF, HH, WIM). These simulations capture the probability of being in different market regimes across the forward time horizon considered. For example the probability of being in a ‘tighter market regime’ for any given simulation is higher in 2022 (a year of low supply growth) vs 2025 (a year when new Qatari supply may come online).
Each price simulation reflects the underlying price dynamics of the prevailing regime e.g. the behaviour of price spreads, correlations, volatility & charter rates. This enables the optimisation & valuation of an LNG portfolio under a broad range of plausible market outcomes. Most importantly, this approach generates distributions of price and portfolio value outcomes that confront the challenge of market uncertainty.
Shifting market pricing dynamics are set to become much more important over the next 5 years. A robust price simulation capability underpins the ability of commercial LNG teams to create and manage portfolio value under changing market conditions. Trying to manage a portfolio without it, is a bit like trying to win an air battle without any radar.