Gas storage facilities have traditionally been the seasonal balancing force in the European gas market. Across the EU-28 countries there is around 90 bcm of gas storage capacity, supporting an inventory of approximately 20% of total gas demand.
The first week of April marks the start of the storage year. This is typically the point in the annual storage cycle when facilities switch from winter withdrawal (at higher winter prices) to injection (at lower summer prices). This year European storage facilities are holding an unusually high inventory into the start of the storage year. This will contribute to downward pressure on European hub prices over the summer.
European storage volume and price dynamics
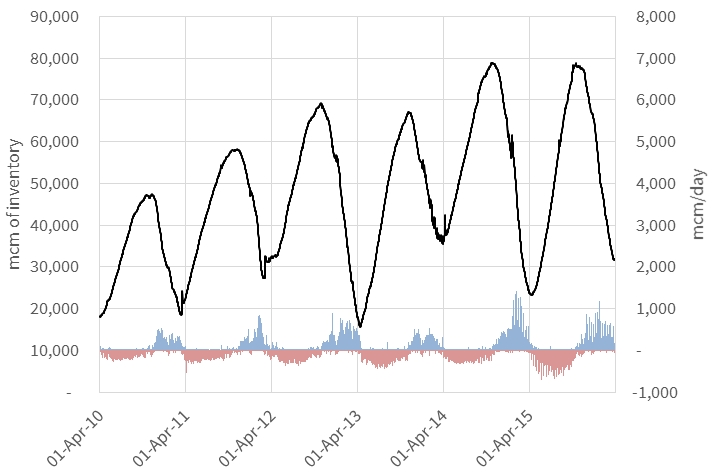
Gas Infrastructure Europe publishes daily updates of storage inventories, injection and withdrawals across the EU-28 countries. While the data is not perfect it gives a useful overview of storage trends. Chart 1 shows the evolution of inventories and flows this decade.
Chart 1: EU-28 storage inventory, injection and withdrawal data

Source: Timera Energy (GIE data)
The increasing inventory over time is partially driven by new and existing facilities being added to the GIE database. The chart shows current storage inventories (32 bcm) are around 30% higher than at the start of the 2015-16 storage year 12 months ago (24 bcm). In 2016 Europe is set to carry the highest storage inventory into summer so far this decade, excluding summer 2014 (when the first down leg of the current global gas price slump occurred).
There have been two main drivers of a high storage inventory into summer 2016. On the demand side it has been another relatively mild winter curtailing gas consumption. On the supply side production flows have been higher than expected over the winter, particularly from Norwegian fields.
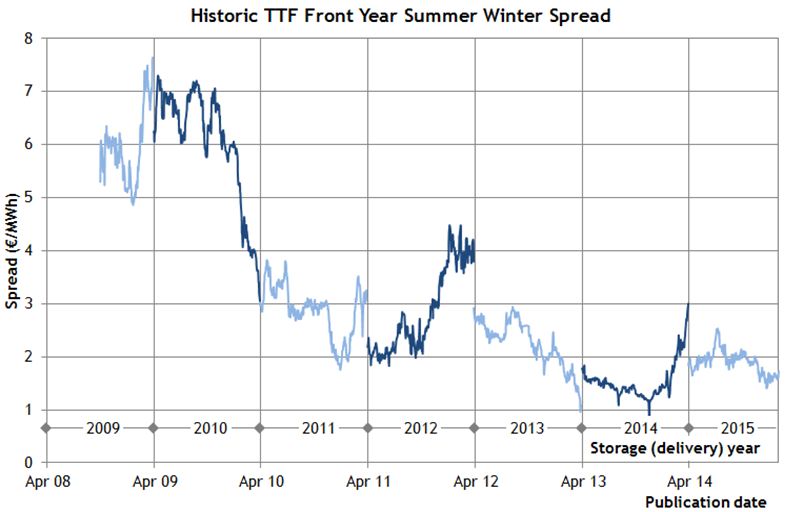
Storage capacity holders are also suffering from very weak market price signals. The key market signal that drives storage injection and withdrawal is the summer/winter price spread. The seasonal spread at European hubs is currently at historically low levels as shown for TTF in Chart 2.
Chart 2: TTF summer/winter price spreads

Source: Timera Energy (LEBA data)
With a weak seasonal spread price signal, the focus of storage traders shifts to optimising against shorter term fluctuations in prices (i.e. spot price volatility becomes more important). As winter draws to a close, the price differential between the day-ahead and forward hub prices becomes an important driver of storage withdrawal decisions and inventory draw down. Gas is typically withdrawn as long as the spread between the day-ahead and summer contract prices remains positive (allowing for gas transport & transactions costs). But day-ahead prices have remained relatively weak across Q1 given benign market conditions. That has led to lower withdrawal rates and a higher storage inventory level than normal.
Roll on the summer
Buying gas to inject into storage is a key driver of summer demand at European gas hubs. Higher levels of storage inventory into summer 2016 mean that there is likely to be around 7bcm less demand for injection this summer than there was last year. That adds to downward price pressure at European hubs. There are two other important factors that come into play over the summer that will likely reinforce this price pressure.
Firstly the slump in oil prices at the start of 2016 is going to start to feed through into oil-indexed contract prices across the summer. This means cheaper pipeline gas imports and an incentive for suppliers to profile their volume take accordingly.
Secondly European absorption of surplus LNG cargoes is set to increase as the year progresses. The huge Gorgon LNG project in Australia has just shipped its first LNG cargo. Gorgon production joins the ramp up of the 3 Gladstone LNG projects in Queensland and Sabine Pass in the US.
The combination of these factors will be an important test for the resilience of European gas hubs as the summer progresses. Front month NBP & TTF prices fell below 4 $/mmbtu last week, helped by a weakening pound. That means the spot spread of NBP/TTF over Henry Hub has narrowed to around 2 $/mmbtu. Watch for that gap to narrow further as the year progresses.
Article written by David Stokes & Olly Spinks.


