The balance of the global gas market has shifted substantially over the last 9 months.
“Carbon prices are up 60% over the last 3 months…
…dragging coal & lignite switching levels higher and with them European gas hub prices”
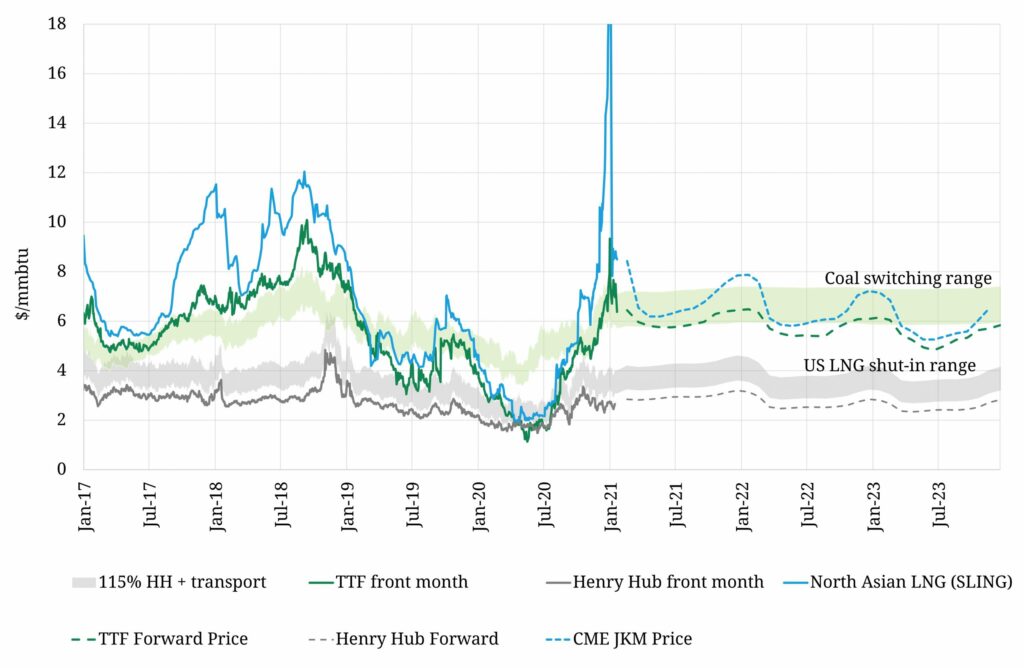
It has been a text book commodity market case study of deluge to drought. Chart 1 illustrates the blistering pace of market tightening since last summer.
The chart is dominated by the Jan 2020 spike in Asian LNG prices. Asian JKM futures prices surged above 19 $/mmbtu, with cargoes changing hands at 39 $/mmbtu in the second week of Jan 2021, a 2000% price increase from the 2 $/mmbtu price levels in Jun 2020.
This winter’s gas price fireworks reflect an LNG market caught offside by cold weather. Within a 6 to 8 week time horizon to delivery, LNG supply is very inelastic (unresponsive to price). This comes down to logistical constraints in the LNG supply chain e.g. due to cargo scheduling, vessel locations/availability and canal & port bookings.
Cold weather hit the northern hemisphere in Dec & Jan causing acute shortages of gas (notably in the Japanese power sector). This caused LNG demand to surge up an inelastic supply curve and prompt prices followed. LNG price rises were exacerbated by a spike in vessel charter rates which rose to 350k $/day (7 times current 1 year charter rates at around $50k).
The impacts of the JKM price spike are largely contained within the current winter. This can be seen in Chart 1, with the JKM forward curve reconverging to pre-spike spread levels to TTF by Q2 2021. But looking out along the TTF forward curve, there has also been a more structural recovery in gas prices since last summer.
The TTF forward curve is now ranging around 6 $/mmbtu (17 €/MWh), well above the US LNG export shut in levels (around 3-4 $/mmbtu) that dominated marginal price setting in 2019-20. Gas market tightening since last summer has ushered in the return of power sector switching in Europe as the core price setting mechanism driving both European and Asian gas prices.
Switching is back
Switching between gas and coal fired power plants was the dominant marginal price setting mechanism in European gas markets across 2016-18, before an oversupplied market started to focus on US Henry Hub support levels below.
Across the last 2 years, Europe has stepped up policy efforts to close its coal fleet. But there is still more than 130GW of coal capacity in operation across Europe. When gas prices rise, gas-fired generation output falls relative to coal output, causing a reduction in gas demand. It is this switching mechanism which facilitates Europe’s key role in providing swing flex to balance the LNG market.
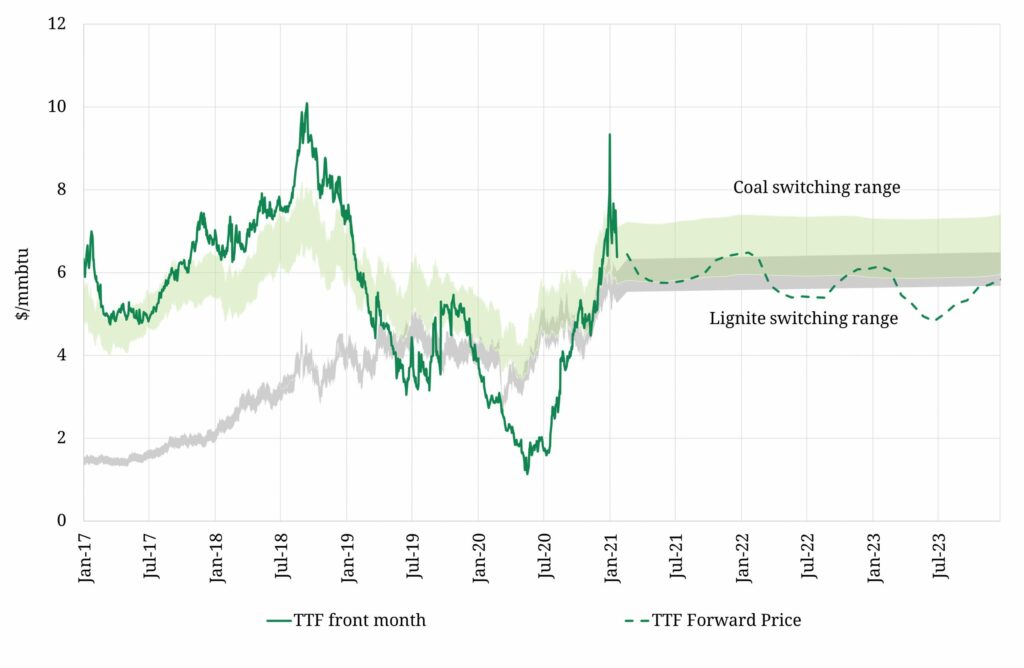
Chart 2 shows the relationship between TTF and switching range benchmarks for hard coal and lignite.
Chart 2 illustrates how TTF prices hugged the coal switching range in 2017-18 before disconnecting lower for most of 2019-20. A rapid tightening in the European gas market this winter has seen TTF reconnect with the switching ranges. TTF forward prices over the next two years are currently sitting across the lignite switching range (shaded in grey) and the lower end of the coal switching range (shaded in green).
Lignite switching prices have a strong relationship to carbon EUA prices. The higher carbon intensity of lignite plants results in around double the sensitivity to EUAs versus hard coal e.g. a 1 €/t move in the EUA price causes around a 0.45 €/MWh move in lignite switching levels compared to a 0.25 €/MWh for coal switching.
The switching level relationship to carbon prices is key. EUA prices (currently around 38 €/t) have risen 15% since the start of Feb 2020 and 60% across the last 3 months. Rising carbon prices act to increase the level of the lignite switching range relative to the hard coal range (as can be seen by the grey range rising relative to the green).
Surging carbon prices are dragging switching levels higher and with them European gas hub prices. This is being reinforced by a recovery in hard coal prices, with ARA prices rising from 55 $/t last summer to around 65 $/t at the moment.
Current pricing dynamics
For the moment the coal and lignite switching ranges are providing important resistance to further TTF price rises. This can be seen in Chart 2 with the TTF forward curve capped by the green & grey shaded ranges.
However this switching range price resistance works on relative not absolute price levels. Rising coal & carbon prices since last summer have dragged switching range levels higher by around 5 €/MWh (2 $/mmbtu), pulling European hub prices with them.
If carbon and coal prices continue to rise, the switching ranges and TTF curve will follow. So carbon & coal prices are worth keeping a close eye on as a key driver of:
- European gas hub prices via switching levels
- European power prices via the dominant role of gas in setting marginal power prices
- Asian LNG prices which are anchored at a spread to TTF via relative netback economics.
European switching has returned as the dominant price setting mechanism at the core of the global gas market.