2019 is going to be an important year of transition for the two key interconnectors that link the UK with Continental gas markets.
The IUK pipe between UK and Belgium is entering its first year without long term contracts. The Q4 2018 introduction of shorter term capacity products is already structurally changing flow patterns and capacity booking.
2019 will also see important changes for IUK’s main competitor, the BBL pipe between UK and the Netherlands. Following on from the merging of BBL with the TTF price zone last year, BBL will commission a reverse flow capability in 2019, increasing the UK’s gas export capacity.
In today’s article we look at the evolution of recent flow patterns and capacity bookings on these interconnectors. We also consider the impact of these changes on market pricing.
A tale of two pipes
A brief summary of the two interconnectors that link the UK gas market with Continental Europe is provided below.
IUK (UK – Belgium)
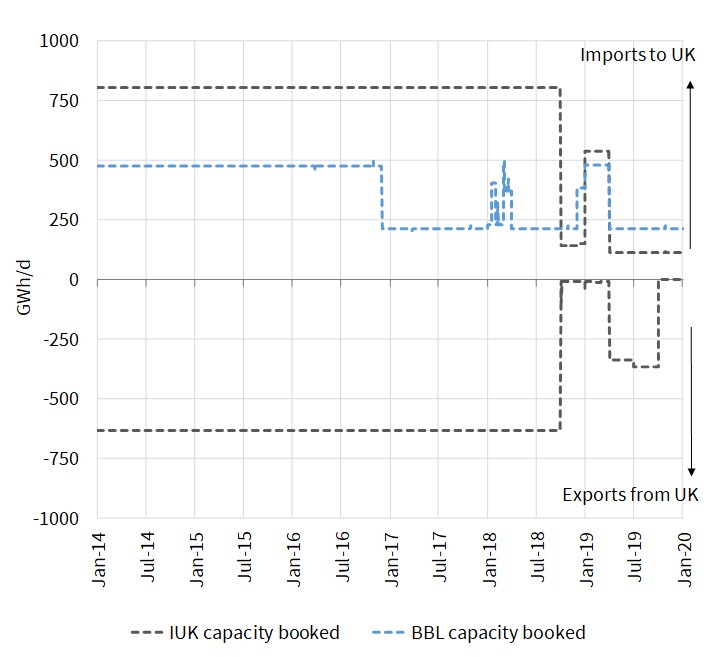
IUK has the capability for physical flow in both directions, linking the NBP and Zeebrugge hubs. IUK was commissioned in 1998, with financing supported by 20 year long term (LT) contracts. These contracts expired at the beginning of Oct 2018. A significant drop in booked capacity volumes has followed as can be seen in Chart 1.
BBL (UK – Netherlands)
BBL currently supports one way flow from (NL to UK), but with a reverse flow capability due to come online this summer. BBL was commissioned in 2009, partially underpinned by a 7 year Centrica – Gas Terra contract which expired in Dec 2016. Again, the impact of the expiry of this contract on capacity bookings can be seen in Chart 1.
Chart 1: IUK and BBL capacity bookings
Source: Timera Energy
Changing tariff structures & competition
The expiry of IUK’s LT contracts has significant implications for flows and capacity bookings on the pipe. Up until Oct 2018, capacity was fully booked under LT contracts, with shippers treating capacity costs as sunk. This meant relatively low variable costs to flow gas and in turn relatively high IUK utilisation.
But now the LT contracts have expired, IUK is selling capacity products on a more dynamic shorter term basis (e.g. via annual, quarterly, monthly & daily products). Before purchasing capacity, shippers are now weighing the cost of acquiring capacity (i.e. product tariffs) against the market price signals that drive capacity value.
This expiry of LT contracts and new tariff structure has led to a significant decline in both capacity bookings and utilisation since Oct 2018 as shown in Chart 2. Gas imports across IUK so far this winter are 12 times lower than for last winter (20 GWh/d average so far in Win 18-19 vs 242 GWh/d Win 17-18), as shown in Chart 2.
This winter’s decline in IUK import volumes has been impacted by the new cost structure of capacity. But it is also the result of higher UK LNG delivery volumes and milder weather reducing the UK’s import requirements.
Chart 2: Daily IUK and BBL flows vs capacity bookings
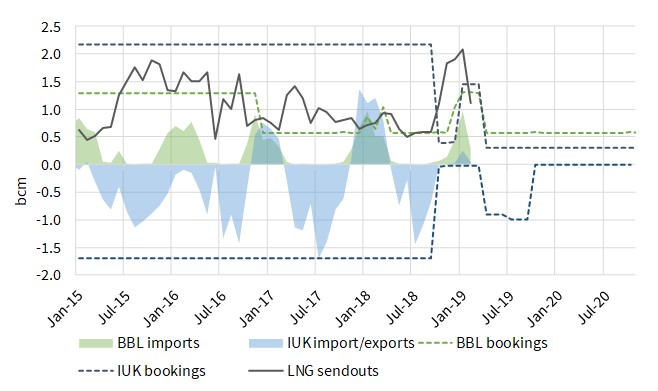
Source: Timera Energy
In addition, IUK is facing competitive pressure from BBL. The recent merging of BBL and TTF (via removal of the Julianadorp interconnection point between TTF and IUK) reduces flow costs from TTF to NBP. Chart 2 shows BBL dominating import flows across the current winter.
From this summer, IUK will also face competition on export flows with the introduction of reverse flow on BBL.
Summer 2019 dynamics
Capacity bookings on IUK this summer are currently lower than peak utilisation levels across the last three summers. But this is not all down to changes in the tariff structure. There is a heavy summer maintenance schedule for Norwegian production fields and UK terminals in Q3 2019 which should reduce the UK’s requirement to export gas over the summer.
The giant Norwegian Troll and Ormen Lange fields will be shut down for longer than usual maintenance periods across the summer. There is also significant UK gas terminal maintenance scheduled (e.g. Segal, Easington). The resulting flow reduction to the UK should be felt mostly in Q3 2019 (Aug/Sep), while there may be flow upside in Q2 2019 with flow rediverted from the continent to the UK.
Lower anticipated export volumes this summer are also consistent with market price spreads. NBP is currently at a relatively small discount to TTF in Q2 2019 compared to recent summers (-1.1 p/th). The spread actually reverses in Q3 2019, with NBP currently at a small premium to TTF.
What impact will interconnector changes have on market prices going forward?
The NBP – TTF price spread is the key benchmark for price differences between the UK and Continental Europe. Price spread levels are driven by the marginal cost of flowing gas between markets.
The flexibility to flow gas between NBP and TTF is focused on three key sources. The most dominant of these sources is the extensive pipeline & upstream network of the Norwegian Continental Shelf (NCS). This allows Equinor the flexibility to flow gas to the UK or multiple entry points on the Continent (although in practice this flexibility is focused on Emden & Dornum).
The NCS is typically the lowest marginal cost source of flexibility to arbitrage price differences between NBP and TTF. In other words, the NCS sits at the bottom of the ‘flexibility merit order’.
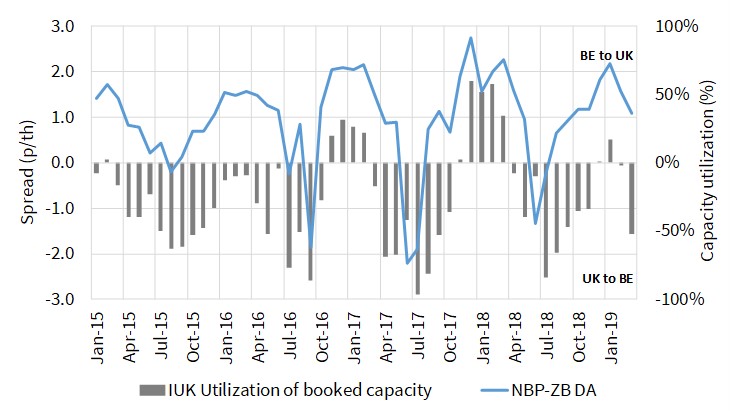
But additional flexibility is often required to flow gas across the Channel. This means NCS flexibility is often supplemented by IUK and BBL flows, with the marginal cost of flowing gas across these interconnectors being an important driver of UK vs Continental price spread levels. Chart 3 shows the strong relationship between IUK booked capacity utilisation and the NBP-ZB price spread.
Chart 3: Monthly average IUK utilisation vs NBP-ZB price spread
The level of price spreads has a strong relationship to shipper’s variable transit costs. This is why the expiry of a large volume of LT contracts at IUK is important.
Historically IUK shippers have treated the cost of capacity as sunk (given LT contracts). But with the transition to short term booking of capacity, shippers are including the cost of capacity in their flow decisions. In other words, price spreads are rising to reflect the full costs of transit, both capacity tariff and variable transit charge.
The change in IUK tariff structure (from LT contracts to shorter term products) has pushed IUK towards the top of the flexibility merit order. It remains a key piece of UK gas supply infrastructure, but has effectively become a ‘peaking’ provider of flexibility, given the associated increase in marginal flow costs.
The influence of IUK marginal costs on price spreads is set to be focused on periods of peak winter import demand, or periods of higher summer export surplus. During these periods, the pass through of higher IUK marginal costs is likely to translate into higher price spread volatility.
An increase in NBP-TTF price spread volatility is good news for the owners of interconnector capacity (given it increases value). But it is important to note that this value increase only accrues to the existing owners of capacity, not the marginal buyer whose pass through of costs is driving up the price spread.
2019 should be an interesting year to watch in order to better understand the changing role of interconnectors in driving price spreads between Europe’s two key hubs.