Irreversible momentum is building behind European power sector decarbonisation. This is a tough but achievable goal. But the popular ‘renewables + storage’ narrative oversimplifies the challenge ahead. Europe requires much broader investment in flexibility.
“A €25bn requirement for flex investment by 2025, rising to €55bn by 2030… Faster decarbonisation increases the capacity deficit as other sectors electrify.”
Decarbonisation is driving a seismic shift towards renewables and away from coal. Many countries are in parallel closing nuclear fleets.
Renewables targets have recently been boosted with over 340GW of new wind and solar capacity now projected by 2030. But the analysis we set out in this article shows that renewables investment is not enough to plug the coal and nuclear capacity gap.
Substantial investment in flexible capacity will also be required, we estimate at least €25bn by 2025 and €55 bn by 2030.
The parallel closure of coal & nuclear
In this blog article, we focus on analysis of 7 key liberalised markets that are closing large nuclear & coal fleets and rapidly deploying renewables. We refer to these as the E-7 countries (Germany, France, UK, Belgium, Netherlands, Italy & Spain).
All E-7 countries have now either closed their coal fleet (Belgium) or announced legislation to close coal. That will result in at least 30GW of coal closures by 2023 and more than 50GW by 2030.
Chart 1 shows the rapid drop in E-7 coal capacity by 2030, based on announced coal closures and legislated coal exit dates.
Chart 1: Installed coal capacity E-7
Source: Timera Energy
In parallel to coal closures, nuclear capacity is also falling fast. Germany will close its entire nuclear fleet by 2022, Belgium by 2025. Even the traditionally pro-nuclear France has set a target to reduce its nuclear fleet by 2035.
In our view, France will likely water down proposals on nuclear capacity closures over time, particularly given their negative impact on decarbonisation efforts.
The “Slow nuclear retirement” scenario in Chart 2 represents a more conservative view on E-7 nuclear closures. This scenario is used for the rest of the analysis in this article. The “Fast nuclear retirement” scenario shows the additional capacity deficit if nuclear plants are closed based on announced policy schedules.
Chart 2: Nuclear capacity changes E-7
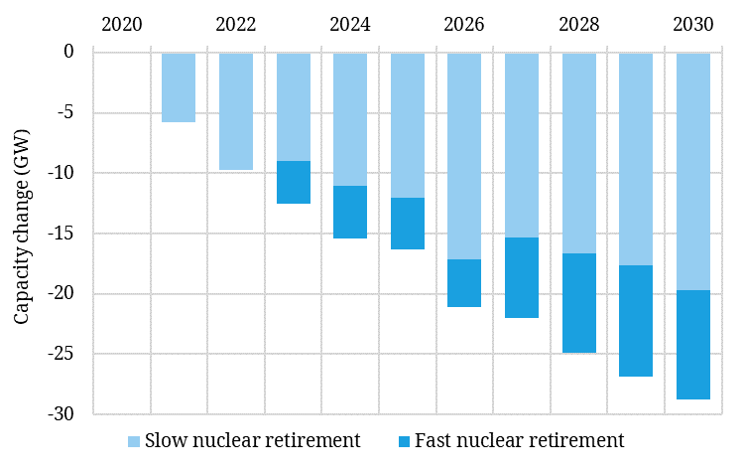
Source: Timera Energy
Ramping up renewables
Falling costs have supported a renewed policy push to develop renewables. Targets across E-7 countries imply 150GW of wind and solar build by 2025, 330GW by 2030.
Achieving these targets will not be easy. There is a significant current mismatch between renewable policy support and goals. Issues with subsidy caps and planning restrictions do not help. However for the purposes of analysis in this article we assume E-7 2030 renewable targets are met.
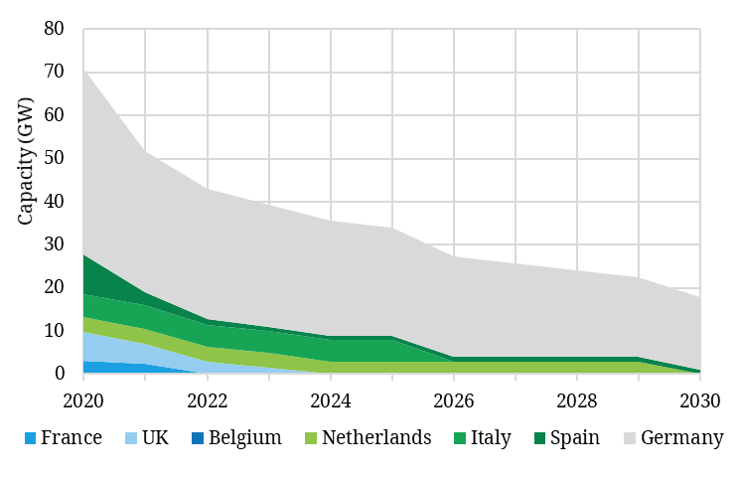
In Chart 3, we show the projected net growth in renewable capacity by country out until 2030. Again for simplicity we assume a linear ramp up in renewables build to meet targets. In practice, build volumes are likely be somewhat skewed towards later in the decade.
Chart 3: Cumulative renewables capacity growth E-7
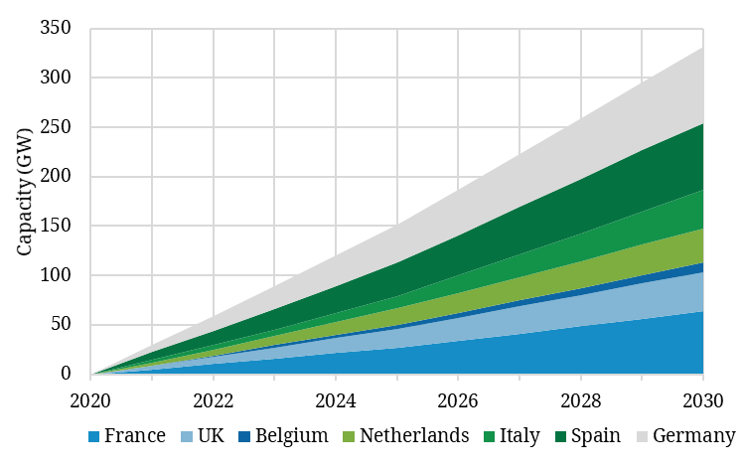
Source: Timera Energy
A rapidly rising flexibility deficit
On an annualised energy basis, renewables broadly keep pace with the closure of nuclear and coal. But simple annual energy accounting disguises a range of major issues.
The most obvious of these is a growing capacity shortfall. Power systems require a certain volume of dispatchable flexible capacity to maintain security of supply in low wind & solar periods.
Average load factors for renewables range from around 10% for solar to 40% for offshore wind. But security of supply standards across Europe are set based on much lower de-rating factors (e.g. in UK 12% for offshore wind, 2% for solar). These factors reflect the equivalent firm capacity contribution of additional wind & solar build.
Chart 4 shows the net capacity impact of closing coal and nuclear and replacing this with intermittent renewable capacity. The chart also shows projected peak power demand growth as electrification of transportation and heating starts to unfold.
Chart 4: Cumulative net de-rated capacity changes E-7
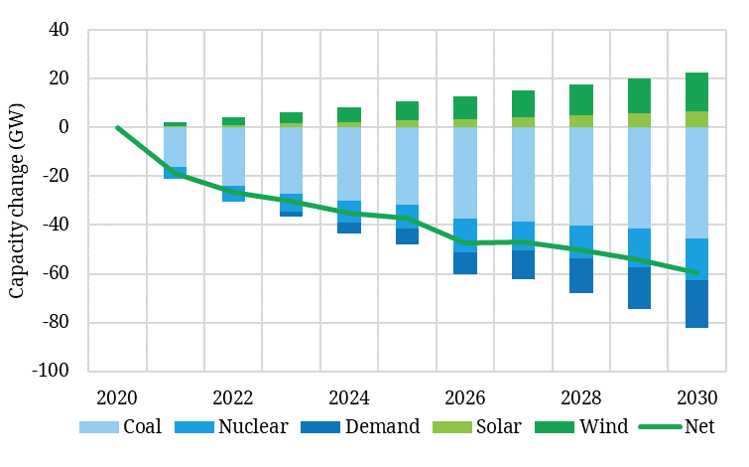
Source: Timera Energy
The chart shows a substantial capacity deficit opening up across the 2020s, with a net 30GW decline in E-7 de-rated capacity by 2023, growing to 60GW by 2030. These numbers are much larger if all European countries are included (vs the E-7 countries we analyse today).
On top of these scheduled coal & nuclear closures, an additional 20-30GW of gas plant closures are likely across UK, ES & IT. These are plants (e.g. built in the 1990s or earlier) that will reach the end of their operational life and require repowering or major capex to continue to operate.
The capacity deficit we set out in our analysis is substantial, but reflects a relatively conservative view, given we assume renewable targets are met and nuclear closures delayed. A slippage of just 2 years against renewable targets combined with official nuclear retirement profiles (our “Fast nuclear retirement” scenario), boosts the E-7 2030 deficit by an additional 10GW.
Somewhat counterintuitively, accelerated decarbonisation also increases the capacity deficit as other sectors electrify more quickly increasing electricity demand.
Europe needs 4 types of flex
Analysis in our pan-European power market model shows transformational shifts in flexibility requirements across this decade. By 2030, E-7 renewables may swing up to 215GW within-day (compared to current power demand of around 230GW). More than 100GW swings may take place in the space of minutes as wind & solar conditions change.
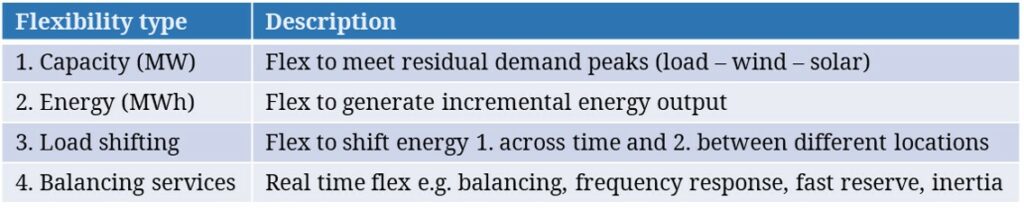
Not all flexibility is created equal. Keeping the lights on will require ramping, storage, load shifting and balancing services at unprecedented scale. We summarise 4 quite different categories of flexibility required to support decarbonisation in Table 1.
Table 1: 4 types of flex required
No one single technology can meet these flexibility requirements. Table 2 shows a heat map view of the characteristics of different asset types in providing flexible capacity. Darker blue indicates a higher contribution to the 4 types of flex required. Red indicates a net negative energy contribution, i.e. the technology uses more energy than it generates.
Table 2: Flex technology heatmap
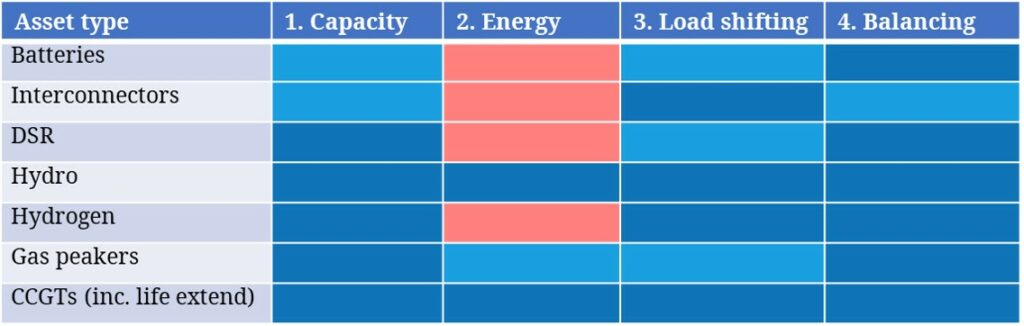
Batteries & DSR: These are two key sources of new low carbon flexibility, with a primary focus on system balancing and shifting load across intraday time windows. But both sources make a zero or net negative energy contribution, as well as having practical duration limitations. This means other flex is needed, particularly to address sustained periods of energy deficit or surplus.
Interconnectors: Interconnectors are important in allowing access to flex in neighbouring markets. Their primary role is shifting energy from lower to higher value locations, but as with batteries & DSR they do not create energy (consuming small amounts via line losses). They also have limited impact in correlated high/low solar & wind events across Europe.
Hydro: Hydro scores highly on all flexibility metrics, however the scope for further hydro developments in Europe is limited by planning & cost constraints.
Hydrogen: Hydrogen fired generation may provide clean and flexible back-up generation capacity, however the production of green hydrogen (via electrolysis) is a net drain on energy.
Gas peakers & CCGT: That leaves gas-fired generation, which is very flexible, but has the obvious challenge of a carbon footprint. That footprint is relatively low for gas peakers (given low load factors) and it will decline over time for CCGTs as load factors fall.
Gas plant utilisation will be supported in the 2020s by the fact that nuclear & coal closures outpace renewables build. Our modelling shows no realistic alternative to gas, even under the most optimistic scenarios of storage, DSR & interconnector development. Gas plant load factors are set to decline in the 2030s as their role transitions towards providing backup flex. But it is difficult to construct a scenario where gas flex will not be required until at least 2050.
The flexibility investment challenge
No one type of flexibility alone can meet Europe’s flex requirements. Storage, DSR and interconnectors are vital for responding to swings in renewable intermittency. Hydrogen has big potential as a low carbon source of flexibility from the 2030s. Gas will also play a key role as a source of incremental energy and flexible back up, particularly during sustained periods of low renewable output.
In our integrated European power market model, we have analysed the investment requirement for the 4 key categories of flexibility and key asset classes to maintain system security of supply standards. Across the E-7 countries we estimate at least a €25bn requirement for flex investment by 2025, rising to €55bn by 2030.
Current policy support is grossly inadequate to deliver this scale of flex investment. But as capacity overhang swings to deficit across the next 3 years, capacity prices are set rise & other support tools are likely to be implemented.
If policy support does not ramp up, then market price signals for flex will respond accordingly (e.g. surging price shape & volatility). Flex will get paid for one way or another – there is little political or public tolerance for poor system reliability.
One of Timera’s key focus areas is working with flexible asset investors and owners on asset valuation and monetisation. We explore these challenges in a second article to follow covering the development of robust flex asset investment cases.
Briefing pack: The flexibility to decarbonise
Click on link to download our briefing pack with detailed analysis on flex capacity investment requirement, building an investment case and asset opportunities. |