Achieving net zero 2050 emissions goals depends on decarbonisation of Europe’s power sector. This needs to happen well in advance of 2050 to facilitate electrification of transport, heat & industry. This looks to be a tough but not insurmountable challenge.
“Longer duration flexibility is the next frontier… and offers enormous investment opportunity”
The heavy lifting in decarbonising the power sector is being done by renewable generation, primarily wind & solar. The well known challenge with these technologies is large swings in output driven by wind & weather conditions.
Battery storage is rapidly emerging as a short term balancing solution for wind & solar. But the economics of lithium-ion batteries are challenging beyond 4 to 6 hours of storage duration. There is no clear low carbon solution to provide flexible output across longer durations e.g. 6 hours to 6 days.
In today’s article we look at two charts which illustrate the scale of recent swings in renewable output, illustrating how critical longer duration flexibility is to facilitating the energy transition.
Mind the flexibility gap
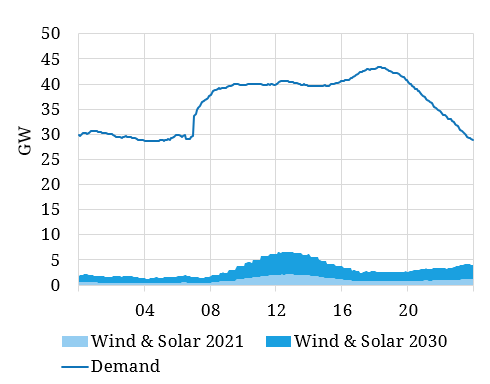
Chart 1 shows a UK case study of demand versus wind & solar generation output across a low wind day in 2021.
Actual 2021 wind & solar output is shown by the light blue shaded region. The dark blue shaded region then shows estimated incremental output from wind & solar, under the same weather conditions, but with a much higher wind & solar capacity installed in 2030.
The chart shows the scale of the gap that needs to be met by some form of alternative low carbon capacity. At the moment this gap is filled by a combination of:
- Gas fired-output: 38 GW of CCGTs & engines (which have a significant carbon footprint)
- Coal-fired output: 4 GW of remaining coal plants, all of which will be closed by 2024
- Nuclear output: 6 GW of nuclear capacity which is closing more quickly than expected and will largely be retired this decade.
By 2030, there is set to be a substantial increase in installed UK wind & solar capacity (e.g. driven by the government’s 40 GW offshore wind target). Demand across the example day shown in Chart 1 is around 800 GWh. Even with 2030 levels of renewable capacity, only about 50GWh (6%) is met by wind & solar output.
Demand will also likely be significantly higher in 2030, driven by electrification of other sectors such as transport & heat, maybe as much as 25-35% higher. But let’s be conservative and ignore any impact of demand growth.
Plugging the gap
Where will the other 750GWh (= 800 demand – 50 GWh wind & solar) of output come from on a day like this to plug the gap? By 2030, the UK is projected to have over 10GW of battery storage, with an energy capacity of 20-40GWh (depending on average duration of installed batteries). This battery flexibility will be key for short & sharp balancing swings, but is pretty small in the context of the output gap (which can run across multiple days as we explore below).
There will be some contribution from other low carbon technology e.g. hydro, waste & remaining nuclear. Interconnector imports may also help, but 2021 has shown how correlated wind patterns tend to result in all of NW Europe fighting for available flexible output at the same time.
The default answer to what fills the gap is the same as it is today: gas. And that is the major challenge Europe faces in decarbonising its power sector. What is a credible low carbon solution for replacement of flexible gas output and how fast can it be deployed to push gas out of the capacity mix over time?
Prolonged gaps across days & weeks
The case we considered in Chart 1 was based on a single day. But periods of low wind & poor solar conditions can often last for several days running. Even 2 to 3 week periods of low output are not uncommon as we saw across NW Europe in Sep 2021.
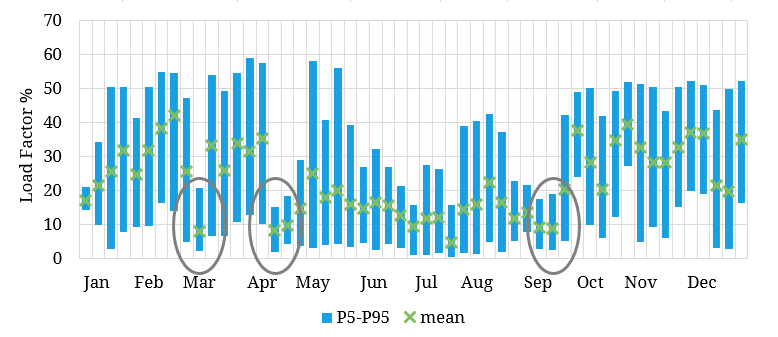
Chart 2 shows weekly average load factors for UK wind capacity alongside the P5 and P95 hourly load factors. The green bars are the weekly average load factors and the blue bars are the range of hourly load factors within the week.
While average weekly load factors across Q1 were around 30%, some weeks were as low as 8%. Based on current wind capacity that is a weekly variation in wind output of up to 1,000 GWh.
By 2030 based on projected installed wind capacities, the output gap (demand vs wind & solar) could rise to over 2500 GWh. Installed battery capacity (at 20-40 GWh) represents around 1% of this gap.
Taking the UK as an example, this raises two key challenges:
- Retirements: By 2030, 15GW of existing thermal capacity that services this flexibility gap is set to retire. Investment in replacement capacity, as well as new capacity to meet demand growth, is required to maintain security of supply… but new capacity needs a credible path to zero emissions.
- Carbon footprint: Remaining gas capacity on the system in 2030 (that has not retired) also needs a credible decarbonisation plan to meet the government’s net zero power sector target in 2035.
The UK is just a case study for a challenge that all European power markets face. There are technology & policy solutions that can be scaled up to deliver renewable capacity. Short duration storage is following fast.
It is a scalable longer duration flexibility solution that remains a wide-open field. A number of technologies are competing for viability including long duration storage, hydrogen fired peakers, electrolysers + H2 storage, CCGT + CCUS, interconnectors and biomass.
Longer duration flexibility is the next frontier and it offers enormous investment opportunity.