It has not been a peaceful summer in global commodity markets. After a six month period of consolidation, July saw a renewed broad based decline in commodity prices. This has continued through August as concerns over China’s growth prospects have intensified.
Crude oil prices have plunged back through January levels and look set to test the lows set at the height of the global financial crisis below 40 $/bbl. This will in turn put downward pressure on global LNG prices and European gas hub prices as the year progresses.
All eyes on China
All is not well in China, the global engine room of commodity consumption. The country that used more cement in three years than the US did across the entire the 20th century, looks to be suffering a pronounced economic slowdown.
China devalued the yuan in early August in an attempt to sure up its ailing export sector. This has triggered a new bout of global risk aversion and sharp selloffs in the currencies of other developing markets. It has also been the catalyst for a renewed selloff in commodity prices as fears grow that Chinese demand will weaken going forward.
The surprise yuan devaluation intensified selling pressure in commodities markets. A weaker currency means that raw commodities will be more expensive for Chinese buyers. But perhaps more importantly the devaluation may be a signal of heightened concerns within the Chinese administration as to the state of the export driven economy. The August Chinese Purchasing Managers Index reading (47.8) showed a third consecutive month of contraction. Export data was particularly weak.
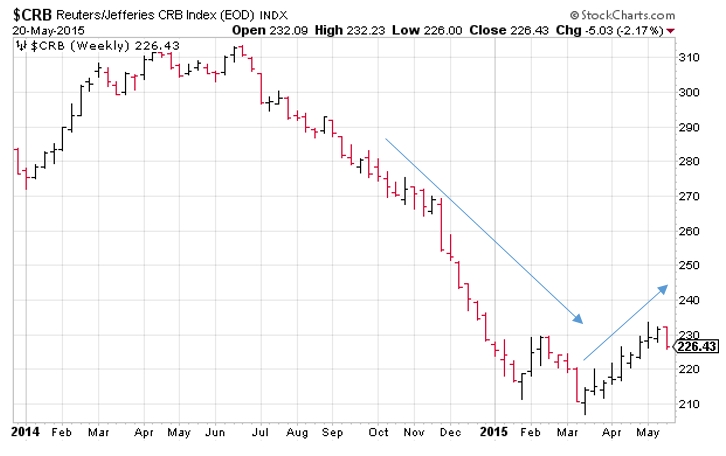
The summer commodity price fall can be seen in Chart 1 which shows the benchmark global commodities index (CRB) breaking down through levels reached at the peak of the financial crisis rout in 2009.
Global commodity markets are sliding down the backside of the commodity supercycle price mountain. Chart 1 is an interesting illustration of the short term elasticity of commodity supply. Given the lead time on investment cycles, the supply of resources is typically slow to respond to increases in demand. This is evident in the dramatic price rises that preceded the supercycle peak in 2008 (driven primarily by rapid Chinese economic expansion).
But production response has a habit over overshooting, as well as being slow to respond to market price declines. As Chinese demand projections have been revised down over the last year, producers in most commodity markets have refocused on battling for market share in the face of precipitous price declines.
The oil rout continues
The oil market is a case study in market share warfare. Since OPEC’s aggressive production stance triggered the price decline below 80 $/bbl last year, global production has increased not decreased. US and Gulf state producers have fought to sure up output in the face of lower prices, driving an increase in crude production of 2 million barrels per day. The lifting of Iranian sanctions (expected early next year) is likely to add at least another half a million barrels per day.
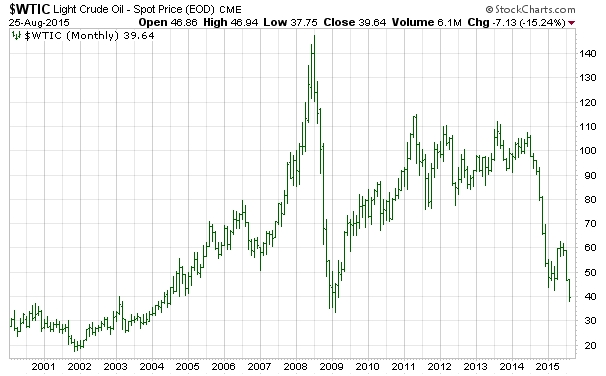
It is this increase in production set against a backdrop of weakening demand projections that has fuelled the latest leg down in crude oil prices. Chart 2 shows the US WTI crude oil price benchmark breaking below 40 $/bbl last week to levels not seen since the peak of the financial crisis in 2009. A big short covering rally at the end of the week saw WTI crude close the week above 44 $/bbl, hinting that the sell off may be over done in the short term. But a structural recovery is difficult to see until the current supply overhang dissipates.
When crude was above 60 $/bbl in May, we set out why we thought oil would head back to 40 $/bbl and remain weak for a more prolonged period than the market was pricing in. That logic still holds and we think the US shale oil investment cycle needs to be materially disrupted to cause a stabilisation in prices back towards crude long run marginal cost benchmarks above 70 $/bbl. Look out for some major distress and consolidation amongst US shale producers over the next twelve months.
The implications for global gas pricing
The latest leg down in oil prices is in the process of feeding through into global gas prices. The role that oil-indexed European pipeline contracts play in setting marginal hub prices, ensures a strong relationship to oil, albeit on an approximately six-month time lag. The bulk of the latest decline in oil-prices will not feed through into European gas contract prices until early next year. But suppliers are likely to utilise any available flexibility to delay contract take until these lower prices take effect (as was seen in Q1 2015).
The majority of long term Asian and European LNG contracts are also oil-indexed. But the slope co-efficient of LNG contracts to oil is typically higher than that in European pipeline contracts. The time lag for contract oil-indexation are also typically shorter. This means that there is likely to be a sharper impact of the crude decline on LNG prices, reinforcing the factors driving Asian & European gas price convergence and acting to increase the flows of LNG into European hubs. Lower oil-indexed hub prices and cheaper LNG imports are set to work in tandem to drive down European hub prices.
In the post Fukushima years (2011 to mid-2014) the global gas market was focused on high oil prices and Asian demand driving regional price divergence, supply concerns and a premium to ship gas to Asia. That thesis has undergone a sharp reversal in the space of just 12 months. Now lower oil prices and an oversupply of new LNG production are driving regional price convergence and a downtrend in prices back towards those at the US Henry Hub.