Decarbonisation of the European power sector is accelerating, supported by revised European emissions targets. In parallel, policy focus is ramping up on the electrification of transport, heat & industry.
“The good news is that there is a lot of renewables capacity on the way… but there are two important considerations to digest”
This is driving rapid structural changes in power market supply & demand dynamics. We are closing conventional thermal assets, at the same time we are driving up power demand and integrating very large volumes of intermittent wind & solar capacity.
This is a tough but achievable objective, but it depends on adequate investment in flexibility.
In today’s article we set out 5 structural drivers of change across European power markets. We then use a case study to illustrate how these impact market supply & demand dynamics and price signals for flexible capacity.
5 structural changes in power markets to 2030
1.Coal & gas closures
Coal & gas plants currently dominate the provision of flexibility across European power markets. They are set to close at a blistering pace this decade, with at least 50GW of regulatory driven coal & lignite closures in Western Europe by 2030, the majority of these by 2025. At least another 20-30GW of gas plant closures are likely given ageing assets. This is set to transition European power markets from flexibility surplus to deficit across the next 2 – 3 years.
2.Nuclear closures
The German nuclear fleet will be fully retired next year, the Belgian fleet by 2025. The ageing UK nuclear fleet is also closing faster than anticipated. Western Europe will likely lose 20-25GW of capacity by 2030, with the volume of French closures the key source of uncertainty. This equates to a substantial loss of energy, given on an average per GW basis, nuclear plants produce approx. 3 times the energy output of wind and 8 times that of solar, given higher load factors.
3.Renewables build
The good news is that there is a lot of renewables capacity on the way, thanks to falling costs and focused policy support. Europe looks set to develop more than 350GW of incremental wind & solar capacity by 2030 to hit recently revised policy targets. While these are impressive volumes there are two important considerations to digest:
- On a derated basis, thermal capacity is set to close at a faster pace than renewable capacity replaces it across the next 5 years, driving a significant tightening across European power markets.
- Replacement of existing flexible capacity with intermittent wind & solar capacity will sharply increase system flexibility requirements to balance markets and maintain security of supply.
4.Demand
European power demand has been in structural decline across the last decade. That is set to reverse across the next 5 years as electrification of other sectors (transport, heat & industry) gathers pace. Examples of tangible policy forces behind this increase in demand are the rapid electrification of passenger vehicles and aggressive 2030 hydrogen electrolyser deployment targets (e.g. EU’s 40GW target).
This is set to drive a 10-15 % increase in power demand across European markets by 2030. Demand will become smarter & more price responsive over time, but not at anything like the pace required to prevent substantial increases in peak system demand.
5.Flexibility
There is one uncontroversial conclusion from 1. to 4. above: European power markets require very large and rapid investment in flexibility (we estimate at least €50-70bn by 2030). The heavy lifting here will be done by storage (primarily batteries), peakers, interconnectors & demand side response.
The margin evolution and investment cases of flexible assets are underpinned by capacity, ancillary & network service revenue streams. But above this base tranche of revenue, flexible asset value is driven by two key market price signals: intraday price shape and spot price volatility. Let’s consider how the 5 drivers above impact these price signals.
Impact on supply & demand dynamics
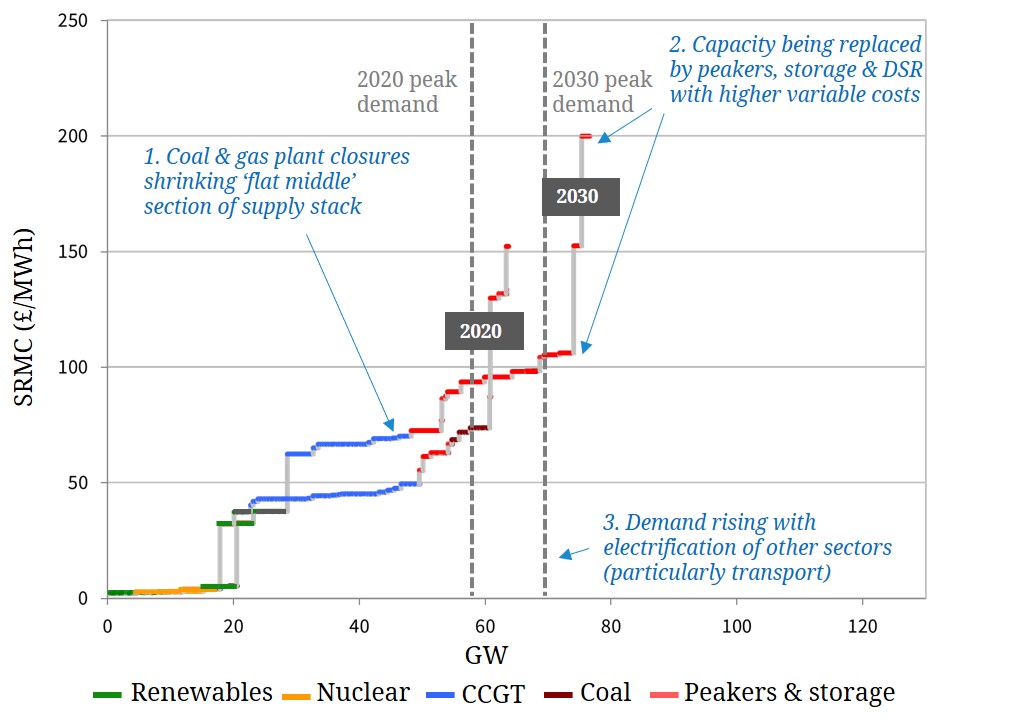
We use a UK power market case study to illustrate the structural changes in supply & demand dynamics set out above. The UK lends itself to a case study because it is a more contained market which illustrates all of the 5 drivers above. However similar dynamics are relevant across most of Europe’s power markets.
Chart 1 illustrates the evolution of the UK supply stack from 2020 to 2030. Capacity in the supply stack is shown on a derated basis using capacity market derating factors (which have the largest impact on wind & solar capacity).