A headline grabbing event occurred in the last week of October. Europe experienced negative gas prices despite being in the midst of an acute energy crisis.
“Our great grandchildren will study the European energy price shock of the 2020s”
Despite the attention this received it was largely irrelevant in the context of the crisis. The negative price print was on a relatively illiquid within-day ICE contract and lasted for only minutes. However it does reflect the extreme volatility at European gas hubs in 2022 as well as some very unusual forward curve dynamics.
In today’s article we look at an animated view of the recent evolution of TTF forward prices. We also explore the impact of a mild start to the current winter and to what extent that helps Europe make it through the next 3 years without Nord Stream gas flows.
The angry serpent
There is a good chance our great grand children will still be studying the European energy shock of the 2020s as a lesson in commodity market volatility. Europe’s key gas benchmark, the month-ahead TTF price, lies at the core of this shock.
Chart 1 shows the animated evolution of the month-ahead TTF price and the associated shape of the TTF forward curve at each month end.
Chart 1: TTF month-ahead & forward curve evolution
Source: Timera Energy, ICE
As with our recent animation of French power prices, we struggle to find adjectives to describe the price volatility across 2022. For some context, the month on month price moves between the last 3 forward curves shown at the end of the animation (end of Aug, Sep, Oct) are each greater than the entire historical range of TTF month-ahead prices before the crisis began.
TTF curve contango driving global LNG shipping squeeze
Astute observers of the animation will notice that the current TTF forward curve in Chart 1 (which extends from Dec 22) shows no sign of low prices. The reason is that low prices have only had an impact in the very near term given an unseasonably warm start to the European winter across Oct and Nov.
In late October, prices for delivery across the remainder of the month plunged below 30 €/MWh compared to mid-winter prices closer to 140 €/MWh. In other words a huge contago opened up in the TTF fwd curve.
The TTF curve has remained in contango into November but at a lower level (with Nov Balance of Month prices around 94.5 €/MWh vs a Dec price of 125.5 €/MWh) as can be seen in the most recent TTF curve in Chart 2 (green line).
Chart 2: TTF curve at 4 points during the 2022 crisis
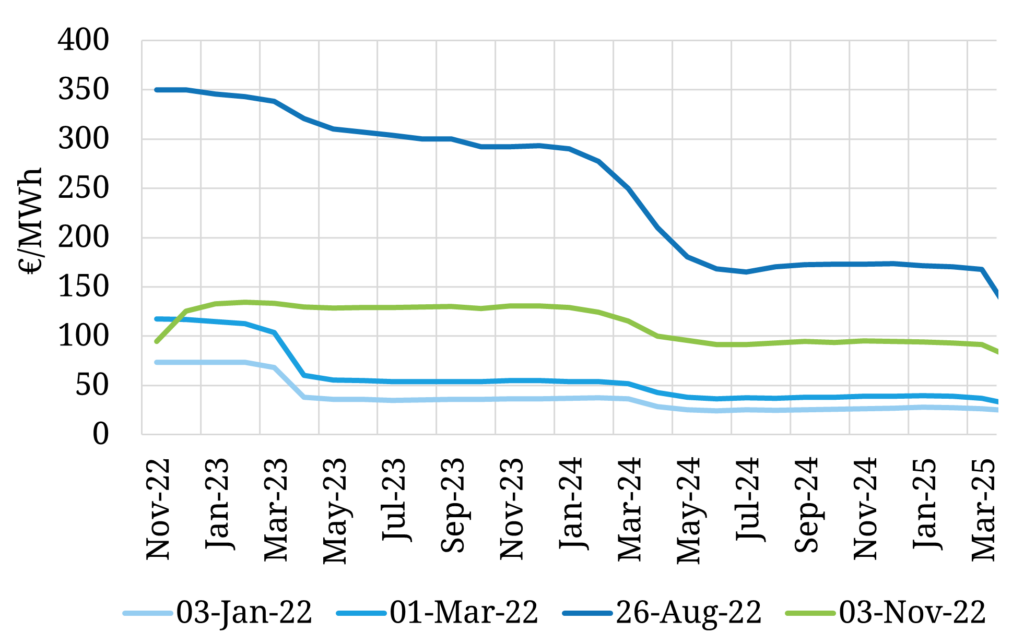
Source: Timera Energy, ICE
The steep TTF curve contango has had major knock on effects in the LNG market. Low near term prices & high storage inventories have been a strong incentive to use LNG vessels as floating storage off the coast of Europe to enable cargo owners to monetise the large increase in forward prices from Oct-Nov vs Dec.
This use of LNG vessels as storage (estimated to be more than 5% of global LNG shipping fleet) in an already tight shipping market has seen spot charter rates soar above 450k $/day. But this charter rate spike is again a near term phenomena limited by the short contango window and a requirement to have sufficient vessels for future loadings. Forward charter rates are below 100k $/day again by early 2023 as vessels return to more normal service.
Where are we in the crisis?
Headlines on low & negative pricing coupled with extreme volatility are contributing to a somewhat confused narrative about the state of play in Europe’s gas crisis. The current situation is best measured by comparing market prices against other important points as the crisis has evolved.
In Table 1 we describe the evolution of the TTF forward prices across 4 key points which map on to the curves we show in Chart 2.
Table 1: four points in TTF forward curve evolution
A warm start to this winter combined with industrial demand destruction has seen a marked decline in gas demand, with Oct 2022 demand down around 25% year on year (the year-to-date decline is significantly less i.e. under 10%). It will be very important to watch how much of this demand reduction is maintained once the weather turns colder. Reducing demand is the key weapon Europe has to fight the crisis and pull prices down.
Warm weather is acting to delay the start of the storage withdrawal season which has two beneficial effects:
- It preserves the storage insurance buffer across the current winter, reducing the risk of supply shortages
- It increases the probability of higher storage inventories at the end of winter, marginally reducing the challenge of refilling storage across Summer 2023.
While this is definitely good news, these impacts are pretty marginal in the overall context of the crisis.
Europe still faces a large Russian supply deficit in 2023 and 2024 (with Russian supply likely to be down at least 100 bcma vs historical averages). While forward prices have declined substantially since late summer they remain at extreme levels.
2023 forward prices are currently at around 130 €/MWh. This is more than 5 times average pre-crisis levels and 150% higher than post invasion levels. The fact that the TTF curve has fallen from 10 times pre-crisis levels in late Aug does not mean the crisis is over.
Europe’s ability to weather the next two years comes down to (i) ability to reduce demand and (ii) LNG market supply dynamics. We focus on the latter in our article next week.
Join our LNG ‘Regime change’ webinar on Nov 17th
Webinar registration link
Time & access: 8am GMT (9am CET, 4pm SST); free access
Topic: “Regime change” – Impact of a new market regime on LNG portfolio value
Content:
- Supply & demand balance impact of European pivot from Russian gas to LNG
- Resulting shift in market pricing dynamics (e.g. price levels, marginal price setting, volatility)
- Implications for LNG portfolio construction (e.g. role of Europe, new supply, value of flexibility)
- Implications for portfolio value management (e.g. European access, shift to ‘within portfolio’ optimisation)
- Impact on risk management (e.g. portfolio hedging; credit risk & collateral issues)