The last 3 years have been tough for UK gas-fired plant owners. A slump in coal prices has given coal plant a clear competitive advantage over gas plant in the merit order. On top of this a steady increase in renewable output is eroding CCGT generation margins and load factors. Yet looking forward over the next 3 years the UK is heading into a period of very tight system capacity margins. But is the market anticipating a recovery in gas plant generation margins as a result?
Several important things have happened since we last looked at UK gas plant margins. The UK power market has now been given a rulebook for the new Capacity Market, which is likely to have broad reaching implications for capacity decisions and power price dynamics as the decade progresses. In the more immediate future there are a number of unexpected plant outages into the approaching winter as we set out here. That has in turn led the system operator National Grid to run an additional tendering process for emergency generating reserve (BSR) into this winter.
A recap on UK gas-fired plant
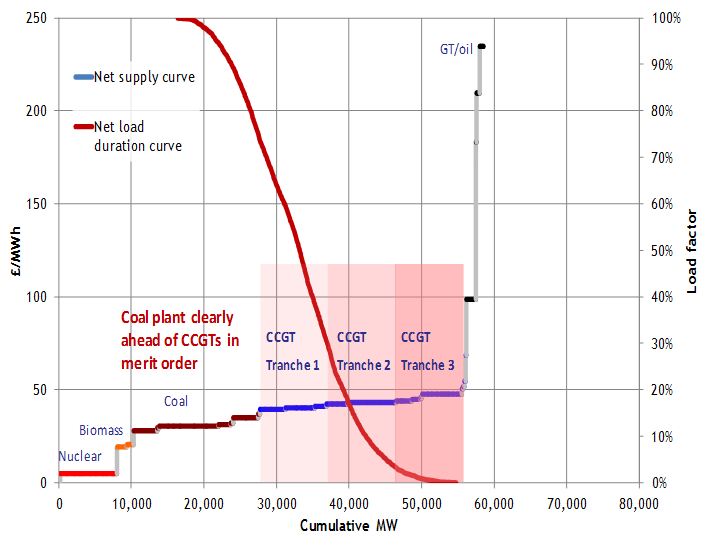
There is about 30GW of CCGT capacity in the UK market which plays a dominant price setting role. CCGTs can be thought of in 3 tranches (of approximately 10GW each):
- Tranche 1: Very efficient and flexible CCGT built in the last few years, currently running mostly as mid-merit plants (e.g. ~50% load factor)
- Tranche 2: Plant of average efficiency and flexibility built around the turn of the century, currently running mostly as peaking plants
- Tranche 3: Older, less efficient and less flexible plant built in the early to mid 90s, currently running at very low or zero load factors
These 3 Tranches are shown in the UK stack diagram in Chart 1 below (for an illustrative set of forward prices).
Market pricing for plant gas margins
Chart 1 shows the dominance of CCGT in the UK supply stack. That results in a strong relationship between power and gas prices. This relationship drives gas plant generation margins (sparkspreads). Market convention is to track sparkspreads based on a defined plant efficiency (49%) and cost structure system, broadly representative of system average parameters. However actual margins earned by individual CCGT vary significantly based on the efficiencies and cost structures of individual assets. Two set of clean spark spreads are illustrated for a generic Tranche 1 (52% efficient) and Tranche 2 (49% efficient) asset at current forward market prices in Chart 2.
Chart 2: UK Forward Clean Spark Spreads (CSS)
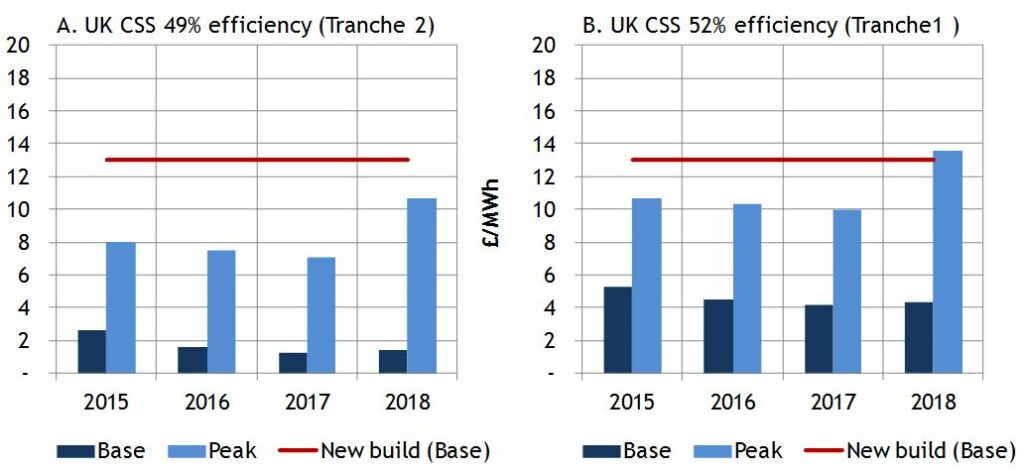
Source: Timera Energy (prices from ICE, Sep 2014)
Market liquidity is very limited beyond 2016, which means that 2017/18 pricing is little more than indicative. But there are a few important observations that can be made:
- Intrinsic value: Plant value that is hedgeable in the forward market is focused in peak periods, particularly for Tranche 2 assets. This means a significant portion of realised asset value depends on capturing price shape and volatility close to plant dispatch.
- Margin recovery: Despite sharply declining system capacity margins over the 2015-17 period (due to scheduled closures), the market is not pricing in any recovery in spark spreads (although note the point below on curve rerating).
- New build: Current forward market pricing is a long way short of what is required to support new build of CCGT (around 13 £/MWh on a baseload equivalent CSS basis), unless a very strong capacity price signal emerges in the new Capacity Market (e.g. 70+ £/kW).
Looking forward
While the current UK market environment is not friendly for CCGT margins, the composition of the supply stack provides a key downside support for CCGT generation margins. Because CCGT plants make up such a large portion of the stack, negative spark spreads are not the problem they are in Continental European power markets. Even at low levels of demand (& high levels of wind output) gas-fired plants are still typically fulfil the role of marginal price setting capacity. A buffer against negative spreads may be cold comfort for UK gas plant owners but it does prevent CCGT plant from being driven completely out of merit as has happened in Continental markets (e.g. Germany, Netherlands).
The really important question is when forward sparkspreads may recover. History has shown that structural shifts in forward market conditions are often precipitated by a shock in the prompt market, for example due to a cold winter or major asset outages. Shocks to the front of the forward curve can result in a rapid re-rating of margins along the curve. And the UK market is certainly vulnerable to such a shock as the system capacity margin tightens across the next 3 years (as we set out here). We suspect market pricing reflects a degree of complacency as to the risks over this period.
Looking beyond the UK market tightening over the next 3 years, the evolution of gas plant margins will depend heavily on the Capacity Market. Capacity payments represent a structural change to gas plant margins, likely to at least cover CCGT fixed costs (as we set out here). However the Capacity Market is also likely to support higher system capacity levels, a factor that weighs on wholesale prices and volatility. As important will be the type of incremental capacity delivered (e.g. OCGT, vs CCGT vs interconnectors) as this will impact price shape and volatility. All these factors point to the result from the 1st capacity auction in December providing some key insights into the long term evolution of gas plant generation margins.