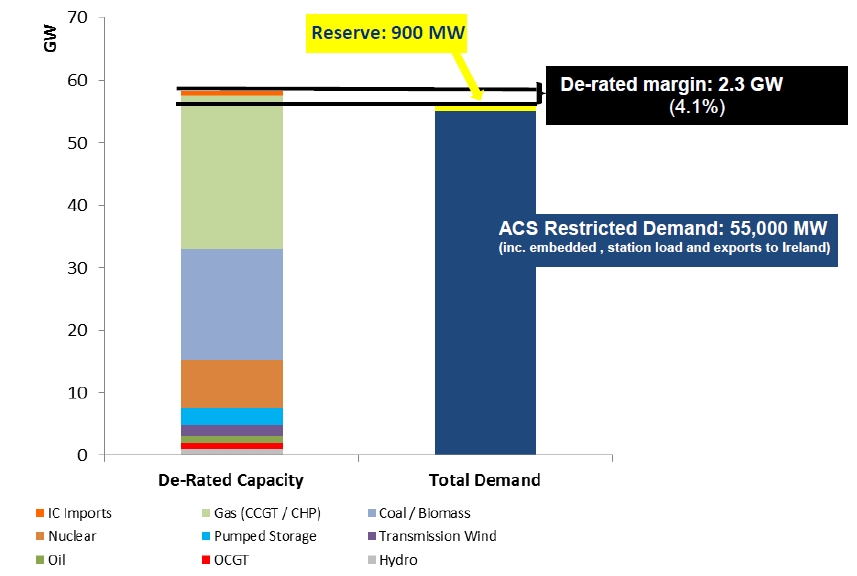
National Grid has now published its view on the UK power market supply & demand balance going into the current winter. The situation looks very tight. Grid’s numbers show a de-rated system capacity margin of just 4.1%. In volume terms that is only 2.3 GW. That is less than the capacity of one of the UK’s larger power stations (e.g. Drax, Longanett).
This does not mean a significant threat of a lights out scenario. There are several units currently on outage that are expected to return early in the winter. Grid also has some additional contracted reserve capacity behind this 2.3 GW margin. It can use this to respond in an emergency situation (e.g. to prevent brownouts or blackouts). But because the majority of this reserve capacity is effectively removed from the wholesale energy market, it won’t act to dampen rises in power prices, generation margins and price volatility if the UK experiences a cold winter.
Winter 2014/15 balance
Grid has published two important pieces of information in the last two weeks which add clarity on how tight the current winter looks:
- Grid’s 2014/15 Winter Outlook shows detailed projections of UK market supply/demand balance.
- Grid has also released details of the volume of Supplemental Balancing Reserve (SBR) capacity recently contracted for the coming winter, showing SBR contracts totalling 1.1 GW of de-rated capacity (covering 2 older CCGTs, an oil plant and some demand side response).
The winter supply & demand balance and 4.1% capacity margin is illustrated in Chart 1.
Forecasting system capacity margins is not a precise science. Uncertain factors such as weather, outages and interconnector flows mean that Grid needs to make a range of assumptions in order to forecast system margins. For example, plant capacities are de-rated to reflect average planned & unplanned outages. Wind levels and temperatures are projected based on historical conditions.
If these uncertain factors combine to produce a more benign outcome as they did last winter (which was both wet and windy), then winter may pass by uneventfully, even with a tight system capacity margin. However if these uncertain factors land the other way, then it may be a very tight winter indeed as we have set out previously.
While at a headline level it may appear that a 4% capacity margin means the market will rely on the operation of a single large station, things are likely to be different in practice. In any given hour, uncertain factors may combine to provide a higher effective level of capacity than Grid assumes, e.g. higher than average plant outputs and higher import levels through the UK’s interconnectors with France, the Netherlands and Ireland. But factors may also conspire to reduce capacity, e.g. multiple forced outages across gas/coal/nuclear plants or conditions of little or no wind (Grid assumes quite an optimistic average 20% output from wind).
What is clear on an historical basis is that tighter system capacity margins coincide with periods of higher prices, higher spreads and higher volatility.
Impact on prices and spreads
The inverse relationship between system capacity margins and prices/spreads/volatility is more than a theoretical linkage. There is a practical mechanism that drives it. A tight system capacity margin acts to increase prices because there are less plants competing to provide the marginal MW required to balance the market. This increases the scarcity rents (the difference between market price and the highest short run marginal cost of the plant at the margin) that accrue to generators.
Historically these scarcity rents have acted as a price signal to encourage new build. But the mechanism for providing a price signal for capacity in the UK market is changing. The signal to retain an adequate system capacity level going forward will primarily come from:
- Pre 2018: Grid’s tendering of SBR capacity, which acts to support older existing gas/coal/oil plants that would otherwise close.
- Post 2018: The Capacity Market, which is likely to favour development of low capex but high variable cost peaking plant.
Neither of these mechanisms are likely to encourage significant volumes of efficient new CCGT plant to increase energy market competition at the margin. SBR contracted plants are removed from the energy market and used only as emergency backup. In other words SBR plants are shifted away from the margin to the very top of the merit order.
Rather than supporting efficient new CCGT build, the first capacity auction is likely to crystallise the weaker economics of a number of older existing coal and CCGT plants. Capacity already existing or under construction (55.8 GW) exceeds the max demand level (50.1 GW at 0 £/kW capacity price) by 5.7 GW. That means at least 5.7 GW of existing plant are likely to be unsuccessful in the first auction (more likely 7+ GW). This volume may be higher if low capex new peaking plant proves to be competitive (although this new capacity will also sit at the back of the merit order). It is reasonable to assume that a significant portion of existing plants will close without capacity price support. That will also act to reduce competition at the margin in the energy market.
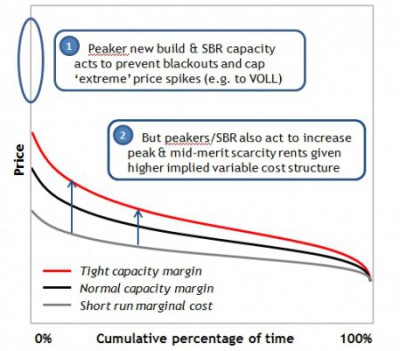
Chart 2 shows a simple stylised illustration of the likely impact of this reduced competition on energy market pricing.
The chart shows a simplified view of price duration curve, the shape of which is distorted in order to illustrate a point. The effects we are talking about are harder to visualise using real market data. The grey line represents short run marginal cost for the system across a given year. It increases to the left to reflect higher marginal cost plants setting system prices in times of peak net system demand. It is also in those periods that scarcity rents are highest given reduced competition at the margin.
The shift from the black line (normal PDC) to the red line (tight PDC) illustrates the impact of reduced competition at the margin. Reducing the number of plants competing at the margin (via SBR and plant closures) acts to increase mid-merit and peak rents. In practice this is achieved by higher and more volatile power prices.
Changes in the UK market design have implemented mechanisms (SBR and the Capacity Market) that allow the government and system operator to more closely control the level of backup capacity. SBR in particular may become a key tool to ensure the lights remain on over the next three years. However these mechanisms are unlikely to stop a pronounced rise in spark spreads, dark spreads and volatility over periods of market tightness.
Full commercial analysis of the 1st auction: For a comprehensive analysis of the 1st auction and its commercial implications you can purchase Timera Energy’s First Auction in Focus briefing report.
The report provides a more detailed analysis of competition between plant types and the marginal pricing outcome in the first auction. Analysis covers the impact of energy market expectations, going forward costs, price maker/taker status, refurb option dynamics and new build competitiveness. The report also explores the key interaction between capacity and wholesale energy market pricing dynamics and the relationship between 1st and subsequent auction outcomes (e.g. T-1 and 2nd T-4). It concludes with a set of key commercial considerations on market dynamics going into the first auction.
For a report prospectus and more details please contact david.stokes@timera-energy.com.


