The UK capacity market was re-instated two weeks ago. This means the immediate resumption of payments for both on-going and historical capacity provided. Importantly, the European Commission found no evidence of discrimination against Demand Side Response (DSR), the claim that underpinned market suspension.
During the period of suspension, the UK government has run a separate consultation process on reforms to the capacity market. This should result in some relatively minor adjustments e.g. wind & solar are set to participate from Jan 2020 provided they receive no other support. But in summary, the capacity market is now back in play and essentially unchanged.
Reinstatement means that three auctions will now be held across the space of five weeks in Q1 2020. These will play a very important role in shaping the UK power market capacity mix into the mid-2020s.
In today’s article we look at the current UK capacity balance ‘state of play’. We also set out why we think capacity prices may surprise vs a pessimistic market consensus.
UK capacity balance: a 15 year perspective
There is a large & growing pipeline of UK wind and solar projects under development. Our scenarios are for between 25 to 30GW of aggregate nominal wind & solar capacity build across the next 10 years.
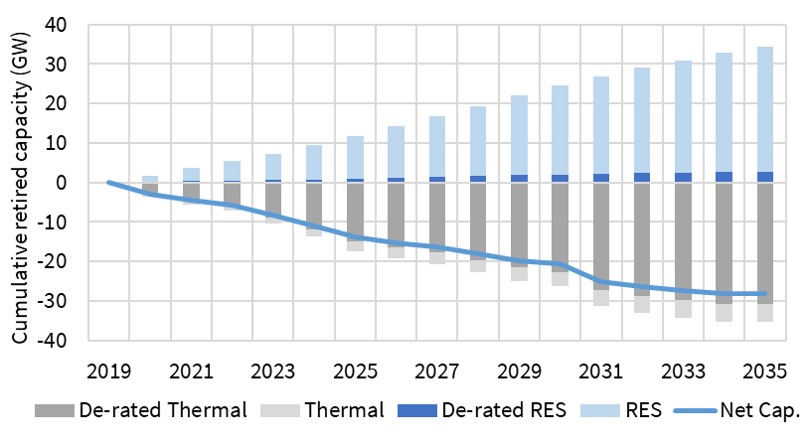
In Chart 1 we show a scenario for capacity growth from Renewable Energy Sources (RES) in the blue bars above the horizontal axis. This is broadly in line with National Grid’s Future Energy Scenarios, recognising some differences in timing and breakdown of capacity types.
But this large nominal volume shrinks to a relatively small volume once capacity is derated for intermittency. For example, 23GW of nominal RES growth by 2030 in the scenario in Chart 1 shrinks to 2GW when derated (using the latest wind & solar de-rating factors announced for the Q1 2020 auctions).
The grey lines below the axis in Chart 1 show a scenario for aggregate thermal retirements. This assumes:
- Coal asset closures as announced, with Drax and Ratcliffe closing by end of 2024 in line with the government’s 2025 deadline
- Nuclear plant closures as per current regulatory schedule
- CCGT closures based on major capex timing and economics of individual units.
Derating has much less impact on thermal units (e.g. CCGTs have a 90% factor vs 7% for onshore wind and 3% for solar). In the chart scenario, 23GW of derated capacity is set to come off the system by 2030.
The blue line shows the net derated capacity gap between thermal closures and RES build. These are primarily replacement volumes to be delivered via the capacity market. In other words 23GW of net closures and 1GW of RES build leaves a capacity deficit of 21GW by 2030.
That is a lot of capacity. And as things stand, it is likely to be primarily delivered in the form of gas engines, batteries, DSR and CCGTs. It is also possible that merchant RES starts to play a more important role from the mid-2020s, although still with more penal derating for intermittent sources.
Why two of the Q1 auctions are important
The T-3 auction will be held on 30th Jan 2020 for capacity delivery in the 2022-23 year (Oct – Sep). Then a T-4 auction will be held for 2023-24 delivery on 5th Mar 2020. These two auctions cover a key window of coal and CCGT closures. A ‘top up’ T-1 auction for 2020-21 will be held in between these, although today we just focus on the more important T-3 and T-4 auctions.
There is 9GW of coal capacity remaining in the UK. In 2021 this will likely fall to 3GW (i.e. Ratcliffe and 2 remaining Drax units). If the current weakness in coal generation margins (CDS) continues, this 3GW may close earlier than assumed in Chart 1 (e.g. by 2023). That could accelerate the requirement for new capacity across the Q1 auctions.
In parallel, 3-5GW of older and less flexible CCGT units are likely to close by the mid-2020s. These are mostly 1990s commissioned units that were not designed for lower load factor flexible operation and are reaching major life extension capex milestones. The level of capacity prices will influence closure timing.
These closure volumes of coal and CCGT units are creating a structural capacity deficit across the auction horizon. This means new build capacity will be required and it will likely be more expensive than in the last T-4 auction.
Capacity price pessimism vs bidding reality
One of the classic human traits that can drive investor behaviour is ‘recency bias’. We tend to place too much emphasis on recent events when making investment decisions.
In this context, the last T-1 auction clearing price (0.77 £/kW) and the last T-4 price (8.40 £/kW), shown in Chart 2, have set a tone of heightened pessimism around future capacity prices.
The 0.77 £/kW T-1 price was essentially irrelevant as we set out in June. The T-1 price is in nature very volatile given a short (1 year) lead time to respond. But as a result of the capacity market suspension, the 2019 T-1 auction was held with a lead time of 3.5 months. That is too short for participants to respond and virtually all bid at/or very near zero.
The 8.40 £/kW price for 2021-22 from Q1 2018 is more relevant for the T-3 and T-4 auctions in Q1 next year. But some key factors impacting bid dynamics have changed over the 20 months since this auction:
- Gas engines have suffered a difficult period of relatively low returns, reducing forward margin expectations and likely increasing bid levels for new projects.
- DSR made up a large share of new build in 2018 (with a significant portion backed by behind the meter gen sets), but has been significantly negatively impacted by the Transmission Charging Review (& lower market returns), with bidding competitiveness likely to fall sharply going forward.
- Batteries are gaining momentum but with investor focus still being on short duration L-ion batteries (with high derating factors) and in relatively small volumes (i.e. hundreds of MW a year vs multiple GW).
- New CCGTs remain a relatively large source of potential capacity, but probably only at scale if capacity prices rise above 20-25 £/kW (particularly given increasing pricing in of decarbonisation risk into 2030s-40s margins).
The combination of these higher bidding dynamics and a growing capacity deficit, creates the backdrop for an upside surprise in the T-3 and T-4 auctions, particularly the 2023-24 auction.
Price levels are hard to predict until full prequalification data is available. But some natural price bounds are emerging around unit economics and bidder behaviour. Capacity prices above 20-25 £/kW are likely to incentivise substantial volumes of gas engine and CCGT new build. Prices below 10 £/kW are likely to bring forward closure of coal plants & CCGTs, supporting prices.
These bounds may be breached in an individual auction. But they are unlikely to be exceeded for multiple auctions in a row.
So what do we mean by a price surprise? Something closer to 20 £/kW than 10 £/kW. Capacity prices at that level would set up significant opportunities for new build in the Q1 2020 auctions.