Last week’s T-4 capacity auction provides an interesting insight into the structural transformation of the UK power market as it decarbonises. Older nuclear and CCGT capacity is steadily exiting the T-4 capacity market, with the coal fleet already gone. This is being replaced by new capacity in the form of DSR, gas peakers, batteries & interconnectors.
“Analysing results of capacity auctions is always interesting…
… but the more important challenge is filtering out the noise to focus on implications for investors.”
These structural changes in the capacity mix are supporting clearing prices in the capacity market. They are also driving a transformation of UK wholesale & balancing market price signals. The current winter is evidence of how price volatility is rising, and with it the returns on flexible capacity.
In today’s article we review the key takeaways from last week’s auction and look at the implications for investors.
What lies behind the 18 £/kW clearing price?
The most obvious takeaway from the auction for delivery of capacity in 2024-25, is the continuing increase in penetration of smaller distribution connected flexible units (DSR, batteries & engines), as transmission connected thermal assets close (e.g. gas, nuclear & coal).
Chart 1 shows a summary of existing capacity that exited the auction and new capacity that was successful. Everything is shown on a derated capacity basis (vs nameplate).
Chart 1: Exiting and New build capacity by type
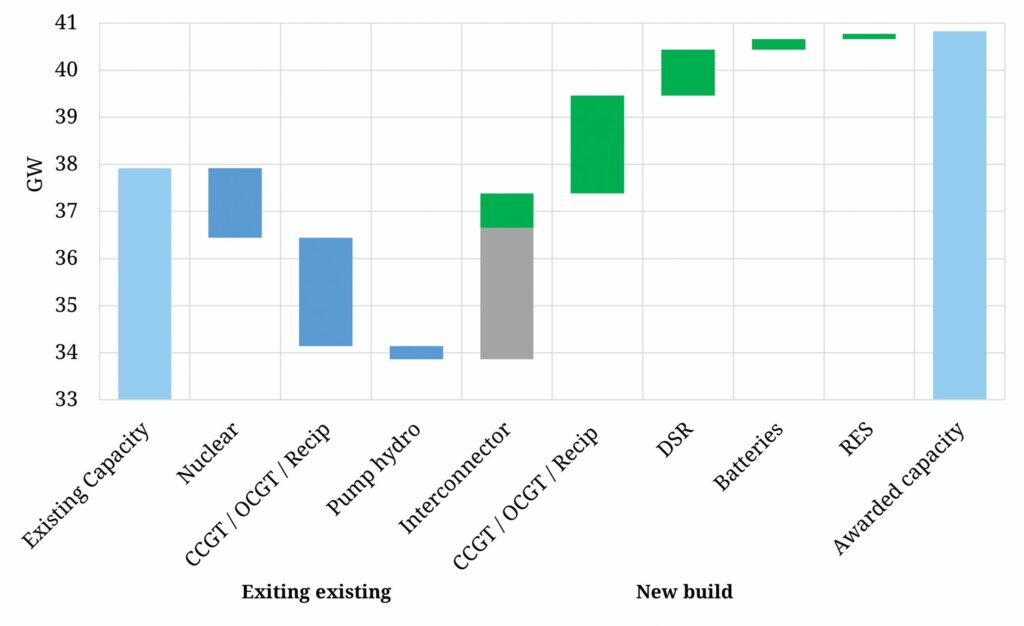
Source: Timera Energy, EMR Delivery Body
Capacity that exited the auction was dominated by:
- 3 EDF nuclear units totalling 1.5GW (at Dungeness, Heysham & Torness)
- Rocksavage & Keadby 1 CCGTs (2.1 GW)
- Dinorwig 1 pump storage unit (0.3 GW).
New interconnectors appear to dominate the provision of new capacity. However 3 of the 4 projects categorised as new build for the auction, had cleared in previous auctions (Eleclink, IFA2 & NSL). Netting off this capacity (shaded grey in Chart 1) leaves the 0.7GW Viking Link (to Denmark) as the only genuinely incremental interconnector capacity.
2.1GW of new and refurbished gas-fired capacity cleared the auction, consisting of:
- Three Drax OCGT projects (0.9GW)
- Refurbishment of 2 Connahs Quay CCGT units (0.7GW)
- Multiple distribution connected gas engine sites (0.5GW)
Just under 1GW of DSR capacity was successful, dominated by large blocks of ENEL X, E.ON & Centrica projects. This is likely to be met by some genuine demand response (e.g. commercial / industrial processes) in combination with plenty of behind-the-meter batteries & engines.
266MW of derated battery capacity cleared (573 MW nominal), with battery durations split about 60% 2 hour and 40% 1 hour. This is consistent with battery margin analysis we are doing showing an increasing value shift towards 2 hour duration batteries as cell costs decline.
While analysing results of capacity auctions is always interesting, the more important challenge is filtering out the noise to focus on the structural implications for investors.
5 key takeaways for investors
1.Prices stabilising:
T-4 capacity prices look to be stabilising in a 15 to 20 £/kW price range. Below 15 £/kW, the fixed cost base of ageing CCGT capacity drive exits. Above 20 £/kW there looks to be a strong supply of new build capacity.
A stable capacity price signal is important to underpin the scale of investment required in new flexible capacity. It also helps build a tranche of stable revenue to support debt financing assets with a more advantaged revenue stack.
T-1 auction prices remain volatile, given what is a much less price responsive and less competitive market (with just over 6 months to delivery). This year’s T-1 auction cleared at 45 £/kW after a late increase in government target (vs less than 1 £/kW last auction). The T-1 auctions are less relevant as a price signal for investors, given relatively low volumes.
2.Distribution connected flex:
Smaller scale DSR, battery & engine projects continue to dominate the supply of new capacity. There is a clear trend in this space towards scale. Earlier capacity auctions featured a large range of smaller developers. But aggregation and the competitive benefits of scale are driving the increasing dominance of a smaller number of established portfolio players.
These include utility backed projects (e.g. Enel X, E.ON & Centrica’s DSR push and EDF’s Pivot Power battery play) as well as flex focused portfolios (e.g. Conrad, Urban Reserve & Flexitricity).
3.Role of gas:
Greenfield CCGT projects look increasingly challenged, given growing decarbonisation risk for assets with an economic life into the 2040s. New CCGTs are also being undercut by the refurbishment of existing units (e.g. Connahs Quay), although opportunities here are limited.
Batteries & DSR can provide shorter duration incremental balancing flex, but gas is still required for seasonal flex and to plug the energy gap in periods of low wind & solar output. Recip engines remain the most advantaged assets here, given relatively low capex & start costs, embedded benefit revenue uplift, shorter payback periods and relatively low cost for future conversion to hydrogen firing.
4.Interconnectors:
Interconnectors have been a strong source of new capacity over the last few capacity auctions. But the current wave of FID’d projects has now cleared and the economics for additional interconnector projects looks increasingly challenging.
Intrinsic price spreads between the UK & Continental European markets have declined. And Brexit has muddied the waters e.g. with the impacts of carbon policy uncertainty & market coupling issues. A reduced supply of interconnector capacity going forward is likely to support capacity prices and increase opportunities for investment in other flexible capacity.
5.Wholesale & BM prices:
The evolution of the UK capacity mix is driving a structural transition in wholesale & balancing market price signals. The UK supply stack has traditionally been dominated by a long flat middle section (underpinned by CCGTs, coal & nuclear). This is rapidly shrinking as older plants close, and the supply stack is steepening as capacity is either replaced with low variable cost renewables and higher variable cost peaking assets.
A steepening supply stack in combination with rapidly increasing swings in renewable output, is driving up wholesale & balancing price volatility. This translates into higher margins for flexible assets as has been evidenced this winter. It is a structural trend that is set to continue.