The Sabine Pass terminal exported its first cargo in Feb 2016. This marked the start of a new era of US gas exports, an almost unthinkable development from a decade earlier when the US gas market was fighting to ramp up its imports of LNG.
While the commissioning of Sabine Pass was of symbolic importance, export volumes in 2016 were relatively small. Only 4.2 bcm [3 mt] of US LNG was exported last year, with capacity limited to Sabine Pass Trains 1 & 2. Train 3 is currently being commissioned, with its first cargo dispatched recently.
A total of 89 bcm [65 mt] of committed new US export supply is due online by 2021, with the greatest volumes scheduled for 2018-19. As US export volumes gain momentum they are set to transform LNG market flow patterns and pricing dynamics.
Where is US LNG flowing?
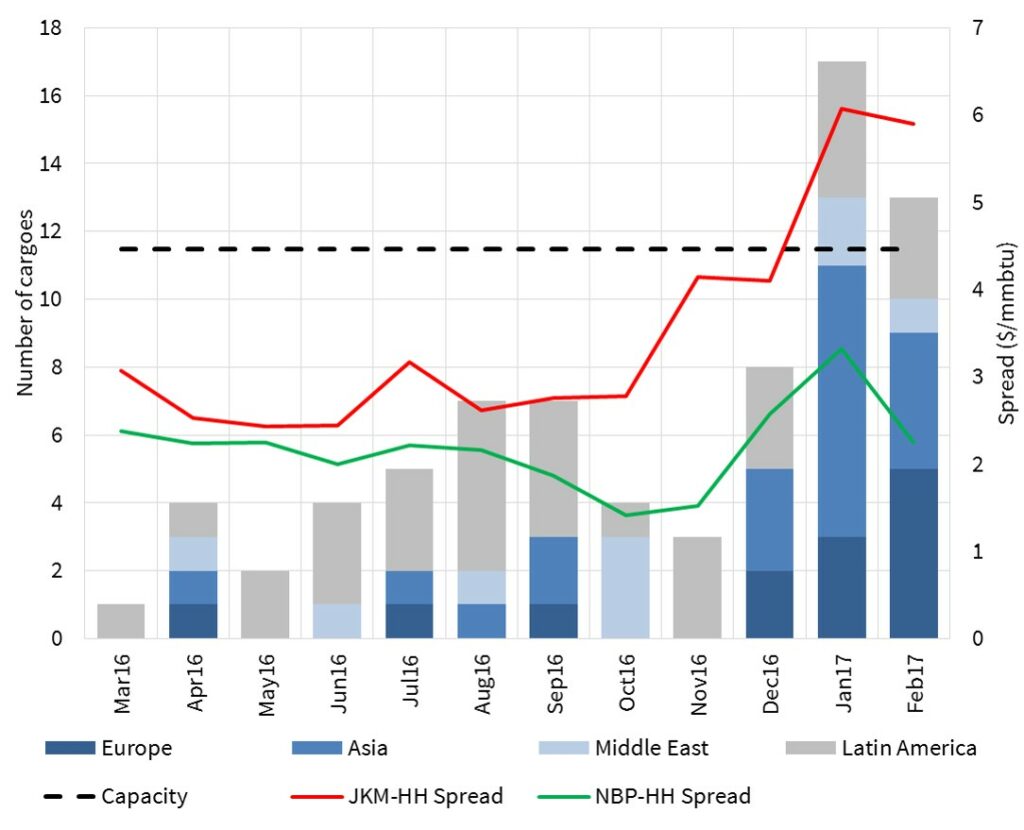
75 cargoes have been exported from Sabine Pass (up until the end of Feb 17). Chart 1 shows a monthly breakdown of US originated cargoes by destination region.
Flow decisions for US export contracts are driven by netback global spot price signals. These represent the market value for exported gas, adjusted for appropriate shipping and regas costs from the US. To provide some guidance on regional price dynamics, we have overlaid the US vs Asian and US vs European spot price spreads on the chart.
A few observations on flows to date:
- Cargo volumes by destination region were split as follows:
- Latin America: 44%
- Asia: 27%
- Europe: 17%
- Middle East: 12%
- Latin America is a natural ‘first destination’ for US cargoes, as short shipping distances reduce netback costs. But Latin American demand is relatively low in a global context, so as US exports increase the Latin American share of cargoes will fall in proportion to other destinations (e.g. Europe).
- The sharp jump in Asian spot prices in Dec saw an associated jump in US export volumes to Asia. Historically, Asia has pulled flexible cargoes from Europe in times of market tightness. Now the US is also contributing as a source of flexible supply.
- Significant outages at Sabine Pass contributed to the dip in export volume in Oct-Nov 16.
While these observations provide an interesting first insight into US LNG flows, we suggest caution in extrapolating these conditions going forward. As US export volumes grow over the next 2 to 3 years, destination and flow dynamics will likely alter significantly.
US exports and the European gas market
A relatively low volume of US exports have landed in Europe to date (17%). But this belies the ‘behind the scenes’ role that Europe is playing in supporting the LNG market. US export volumes are being priced, optimised and hedged based on European hub price signals.
US cargo flow decisions are strongly influenced by NBP and TTF as liquid pricing benchmarks against which LNG portfolios are optimised, even though only a portion of cargoes actually land in Europe. This dynamic is magnified by the fact that significant volumes of US export capacity are held by LNG aggregators who have flexible portfolios and a strong focus on portfolio optimisation.
Liquid North-West European gas hubs have been the key driver of regional LNG spot price signals since the gas glut started in earnest back in the summer of 2014. There have been brief periods of regional price divergence from Europe (e.g. Dec 16 – Jan 17). But the role of Europe as the market of last resort provides the benchmark from which regional spot prices are determined (e.g. in Asia and Latin America).
As well as playing an important pricing role, Europe is set to attract higher US cargo volumes as more export trains come online. After Latin America, Europe is the next cheapest destination for US exports from a shipping cost perspective. As US export volumes grow, significant volumes are likely to land in Europe, or to displace cargoes that flow to Europe from elsewhere. An increase in European cargo volumes can already be seen across the last 3 months in Chart 1.
Gas glut and the importance of Henry Hub
One of the most important implications of US export growth is the rising influence of the US Henry Hub price signal on global gas prices. Henry Hub prices drive the variable cost base of existing US terminals. They also determine the long run marginal cost (LRMC) competitiveness of new US export supply.
As new US export projects are commissioned and the LNG glut intensifies, European hub prices are likely to further converge with Henry Hub. This should increase the importance of a converged trans-Atlantic hub price signal in setting regional LNG prices, with the US gas market providing global price support through the glut.
Some producers and analysts have recently suggested that the LNG supply glut may be ending. In our view, the numbers tell a different story, as we set out in our latest update pack on the LNG glut and asset value implications.
We are sticking to the thesis we set out last year: the LNG glut will remain the dominant driver of gas market dynamics for the next 3 – 5 years. But market tightness may return with a vengeance next decade unless Financial Investment Decisions (FIDs) on new LNG supply are taken soon.
Article written by David Stokes and Olly Spinks