The costs of moving LNG from the US to Europe was one of the key focus points at last week’s Flame conference. A number of divergent views were presented on the level of costs that US exporters need to recover in order to send LNG to Europe. However there was a consensus that the trans-Atlantic cost differential was likely to become a key factor driving gas flows and hub pricing dynamics.
Timera Energy gave two presentations at Flame that set out our view on trans-Atlantic variable costs and the influence of these in driving US vs European hub price differentials. Given the interest this topic attracted, we have focused today’s article on setting out a more detailed breakdown of our assumptions, with a particular focus on the treatment of shipping costs.
US export contract dynamics
US export contracts are structurally different from other LNG contracts. They are structured as a liquefaction capacity option rather than a conventional gas supply agreement. This means contracts have the inherent flexibility to:
- Send export volumes to the highest priced market (on a spot price netback basis)
- Ramp down contract volume take to zero if market prices do not cover variable costs
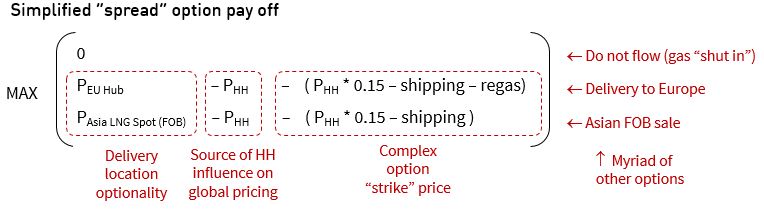
Contract holders pay a fixed capacity fee (e.g. 2.25 $/mmbtu for Sabine Pass). But importantly this is a sunk cost and has no bearing on flow decisions which are driven by variable costs. This means that US export contracts are essentially a complex option on the spread between Henry Hub and regional spot LNG prices. We show a simplified representation of the payoff for this option in the diagram below.
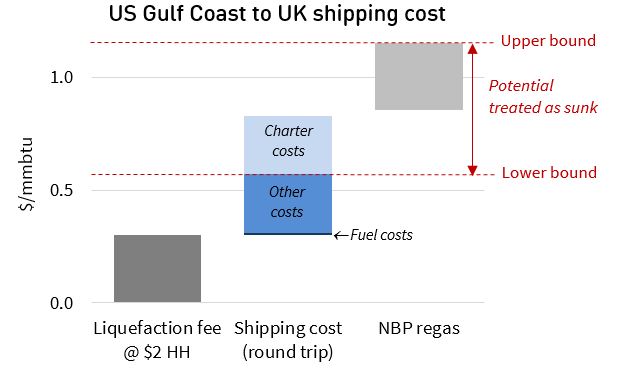
The strike price of this option is driven by the variable costs of (i) liquefaction (ii) shipping and (iii) regas as we set out in last week’s article. We also defined our estimate of a current trans-Atlantic variable cost range for delivery of US exports to Europe as follows:
- Upper bound: 1.10 $/mmbtu
- Lower bound: 0.60 $/mmbtu
It is important to note that these numbers are defined using current market fuel and charter rates which may change going forward.
US export volumes are likely to continue to flow to Europe as long as the spread between NBP/TTF and Henry Hub prices exceeds the upper bound of trans-Atlantic variable costs. Exports may of course flow elsewhere (e.g. to Asia or South America) if netback prices are more attractive.
If trans-Atlantic price spreads fall below the upper bound then a portion of US export volumes may be ‘shut in’. If price spreads fall below the lower bound it is likely that all US export volumes will be shut in. However the cost cut off point for export volumes will vary based on contract, terminal and counterparty specific factors. One of the most important drivers will be the treatment of shipping costs.
Recap on shipping cost components
The key components that make up the cost of shipping LNG are as follows:
Chartering fee: This is the payment for securing access to shipping capacity by chartering a vessel. There are broadly three ways to secure access to shipping capacity: (1) own vessel capacity (2) long term time charter and (3) spot (short term) time charter (e.g. for a single voyage). We tend to focus on spot charter rates as the benchmark driving marginal shipping costs.
Brokerage: Vessel charters are typically arranged through specialist brokers and attract a 1-2% fee.
Fuel consumption: The voyage fuel or ‘bunker’ consumption is directly proportional to the distance and speed of the vessel. This is typically the second largest cost component after the chartering cost. The added complication for LNG vessels is the different propulsion mechanisms and fuel burn options. Most LNG vessels can burn fuel oil, boil-off gas or a blend of both in their boilers. As a result the calculation of fuel cost is closely tied to that of boil-off gas. Natural boil-off occurs at a rate of approximately 0.15% of inventory per day and at times boil off is forced above this level to further reduce the fuel oil requirements. Some modern LNG vessels also have the ability to re-liquefy boil-off gas, keeping the cargo whole (and allowing the use of more efficient diesel engines). Calculation of the direct fuel consumption is fairly straightforward but the opportunity cost of LNG boil-off is also an important consideration.
Port costs: The components and level of the costs of loading and unloading at ports can vary widely depending on location. For example, ports in less stable regions can levy large security charges associated with ensuring the safety of the vessel.
Canal costs: Transit costs have to be paid for using the cross-continental Suez and Panama canals. Suez canal transit costs are a complex function of vessel dimensions and cargo (laden voyages being more expensive) and LNG vessels are entitled to a 35% discount after which the costs are in the region of USD 300-500k per transit. With the Panama canal widening project, around 80% of LNG vessels are able to make the transit. This reduces the distance from 16,000 to 9,000 miles from the US gulf coast to premium Asian markets.
Insurance costs: Insurance is required for the vessel, cargo and to cover demurrage (liabilities for cargo loading and discharge overruns).
Breaking down trans-Atlantic costs
Chart 1 sets out the component breakdown of our upper and lower bound estimates for trans-Atlantic costs.
The basic shipping cost calculations assume:
- 160 MT vessel
- Journey distance 4,900 NM
- Travelling at 14 knots running on boil-off (some small FO in-port consumption)
- 25k pd charter rate
- Plus allowances for port and other costs
- Covers round trip journey (laden and unladen voyages)
Our upper bound assumes full fixed and variable cost recovery and the lower bound assumes exclusion of sunk charter costs and regas costs (although in reality a small proportion of the regas costs are likely to be variable).
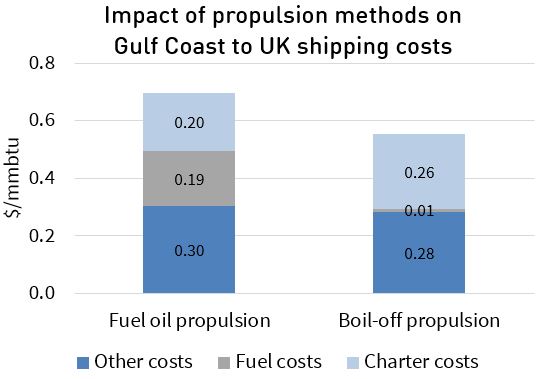
There are some important factors which can influence these cost estimates. Fuel costs will vary by vessel type, with a key consideration being to what extent the vessel runs on conventional marine fuel (e.g. gas oil or fuel oil) versus boil-off. Some vessels can make the trans-Atlantic journey entirely via use of boil-off albeit at a reduced speed (14 knots vs 19 knots). Chart 2 illustrates the impact of running on boil-off vs fuel oil for a Gulf Coast to UK journey.
Running on fuel oil reduces journey time by around 4 days (or 8 days for a return journey) when compared to running on boil-off. The reduction in charter rates from the quicker journey combined against the incremental FO costs can be compared to a longer journey but practically no fuel costs when running on boil-off. Current voyage economics suggest that running on boil-off is the lower cost option. We have assumed 100% boil-off operation in our estimates above, but these increase if vessels burn conventional fuels.
Another key point is the treatment of fixed and variable costs of the ballast (unladen return) voyage. When shipping margins are healthy it is reasonable to assume that in some cases that ballast voyage costs can be internalised by the shipping operator. But under current conditions, low charter rates do not support annual vessel cash costs, so it is reasonable to assume that the variable cost of the ballast journey is included in costs calculations. These are quite low if the vessel is assumed to run on boil-off.
We have not included an allowance for port costs in the US liquefaction fee. There is a lack of transparency as to what charges will be levied on LNG carriers but for other vessel types in can be upwards of $500k.
US cargoes will go to the highest bidder
Any differences in the cost of getting gas liquefied and loaded onto a vessel are likely to be important in determining the ‘merit order’ of US export volume shut ins. But in our view the shipping and regas costs of the holders of US export contracts will not necessarily drive trans-Atlantic flow dynamics. US cargoes will likely be sold to intermediaries if they have access to lower shipping and regas costs.
This is where we believe that NBP/TTF vs Henry Hub shut in spread levels may surprise on the downside. In other words shut ins may be driven more by the lower bound (reflecting sunk shipping and regas costs) than the upper bound (reflecting full variable cost recovery). Cargos will go to the highest bidder and that is likely to be the party with the lowest variable cost structure. Don’t underestimate the ability of market driven innovation to erode the trans-Atlantic price spread.
Article written by David Stokes and Olly Spinks