The first US LNG export train was commissioned four years ago at Sabine Pass. This was in fact the second commissioning of Sabine Pass, which in 2008 had opened as an LNG import terminal, just in time for the dawn of the US shale gas boom.
“The marginal molecule of gas in the global supply and demand balance has an American accent.”
The commencement of US LNG exports back in 2016 marked an important transition from a global supply perspective. Many large LNG buyers saw the US as a source of cheap & flexible supply to supplement inflexible oil-indexed gas from other producers. But despite its new export status, the US gas market remained largely independent of the LNG market which was driven by Asian & European dynamics.
Step forward to 2020 and the global gas market has been turned upside down. The US gas market is now the engine driving European and LNG market pricing dynamics. The marginal molecule of gas in the global supply and demand balance has an American accent.
In today’s article we look at 4 charts that illustrate the role of the US in balancing markets and shaping prices.
-
It all comes down to price
It is no secret that the LNG market has been oversupplied since Q4 2018. Surplus cargoes have flowed to Europe where a price responsive power sector has absorbed gas via switching of gas for coal plants. As such, European hubs were the key marginal clearing mechanism for the LNG market and the main driver of LNG spot prices from Q4 2018 to Q4 2019.
Volumes of surplus LNG have grown in 2020, with commissioning of new supply into a Covid impacted market. This has seen Europe displaced as the driver of LNG market pricing in favour of the US. This was reflected in dramatic style in early Q2-2020 as TTF and NBP hub prices crashed through US Henry Hub levels.
European hub prices trading at a discount to Henry Hub represented price signals shouting ‘Europe has had enough’. Chart 1 shows how as of Jun 2020, forward markets are responding.
Chart 1: European hub prices back above US
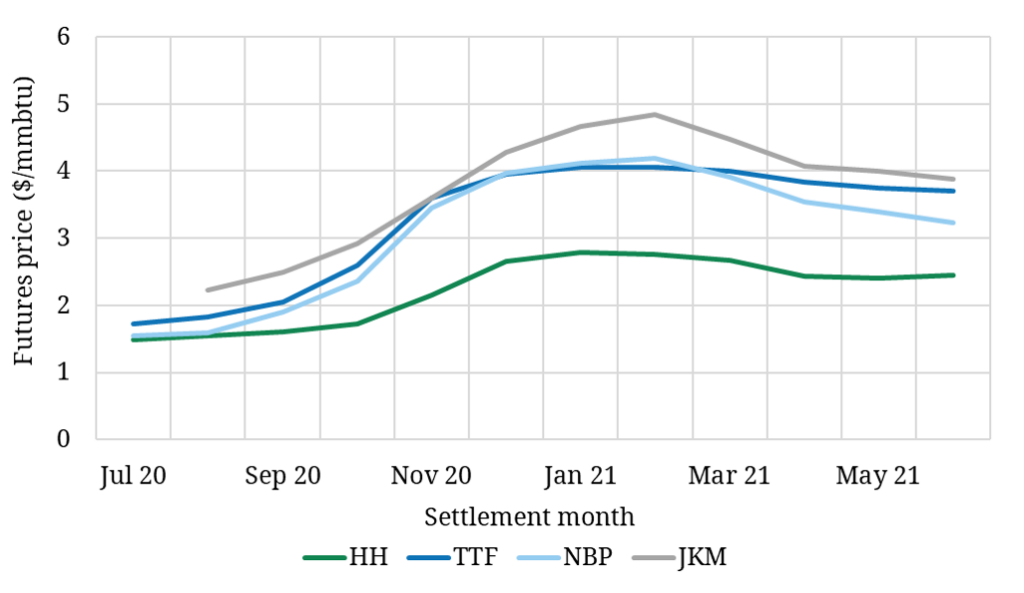
Source: CME, Timera Energy
Both TTF and NBP are now trading back at a clear premium to Henry Hub across Summer 2020 as US export volumes are ‘shut in’. As export gas is pushed back into a US market with high storage inventories, Henry Hub has fallen to its lowest level in 25 years.
Forward curves show the premium of European over US prices rising into winter, as the acute current supply imbalance is alleviated.
-
US shut ins driving global pricing dynamics
Why is the US market currently so important in driving global prices? Because it is the source of marginal flexibility that is allowing global supply and demand balance to clear.
The marginal molecule of global gas (transacted at the intersection of supply and demand) is US. Current price levels have stifled incremental demand from the European power sector and price responsive Asian buyers. So the global market is clearing by forcing US LNG export volumes back into the domestic gas market (i.e. shutting in exports).
Chart 2 illustrates how US export shut in volumes have grown in 2020, in response to the rising surplus in global gas supply.
Chart 2: Daily feedgas volumes into US export terminals
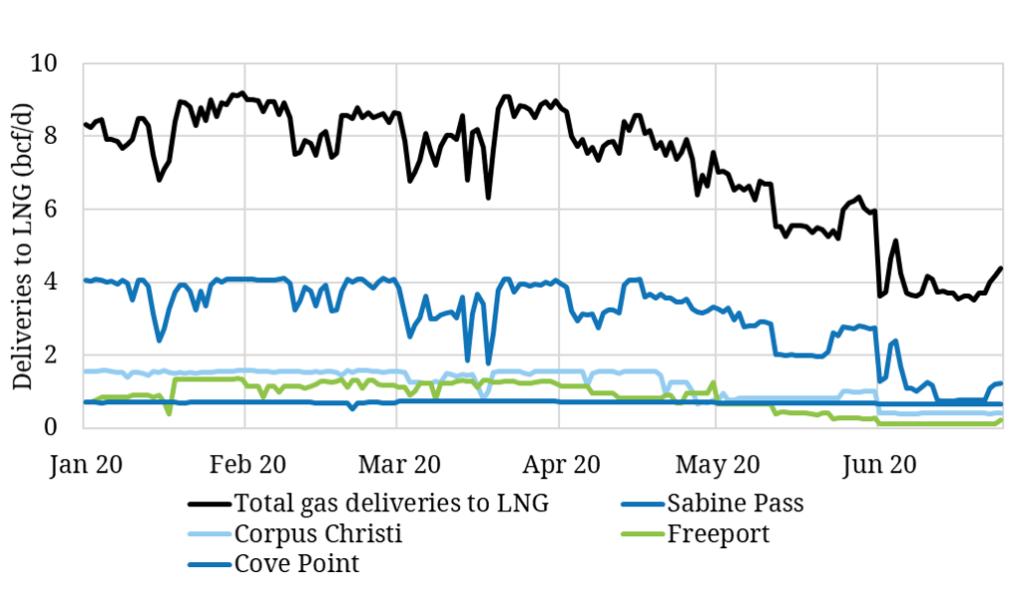
Source: RonH Energy, Timera Energy
As recently as Mar 2020, feedgas volumes into US export terminals were above 9 bcf per day. By early Jun 2020, feedgas volumes had fallen more than 60% (to less than 4 bcfd), despite the ongoing ramp up of new US export trains. Cheniere’s Sabine Pass and Corpus Christi trains have borne the brunt of US shut ins.
By the end of 2020, US export capacity should exceed 10 bcfd. The pace of recovery of export volumes towards this level will be an important barometer to watch, to understand how the global market is rebalancing.
-
US domestic supply now in focus
Charts 1 and 2 illustrate why Henry Hub prices are important in driving European & LNG prices. But what is driving US gas prices?
Shale production drives marginal supply in the US gas market. Falling US hub prices and the impact of Covid has seen the US natural gas rig count decline 40% since January 2020. Chart 3 shows the total US oil and gas rig count falling to its lowest levels on record.
Chart 3: US oil & gas production rig count
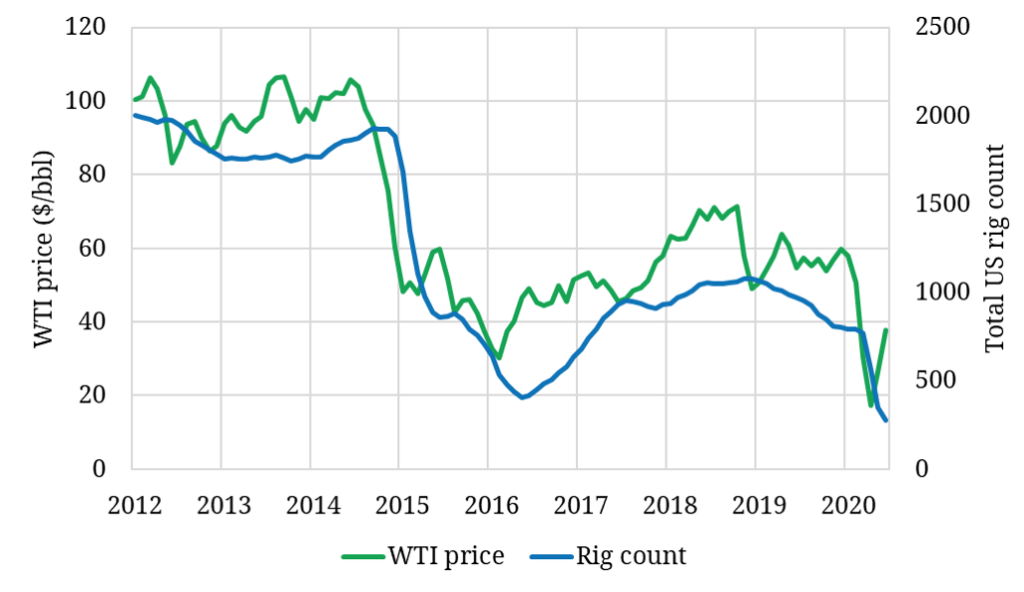
Source: Baker Hughes, EIA, Timera Energy
As well as falling ‘dry gas’ production volumes, the associated production of ‘wet gas’ from US shale oil plays is an important driver of US gas supply volumes. The decline in WTI crude oil prices since the start of 2020 has been significantly greater than the decline in gas prices. This is reflected in the halving of the oil rig count in the key Permian basin from Mar to May 2020.
-
What are US gas & oil futures telling us?
US associated gas production is unlikely to be just a passing interest this summer. It may be a much more important driver of US gas supply across at least the next two years. And it is the source of an important evolving inverse relationship between US gas and crude prices.
Chart 4 shows the evolution of the Dec 21 futures contract for Henry Hub and WTI crude. Something has clearly changed in this relationship since the onset of Covid in Q1 2020. As crude prices plunged, market expectations of the volume of future US shale oil production have fallen along with associated gas volumes.
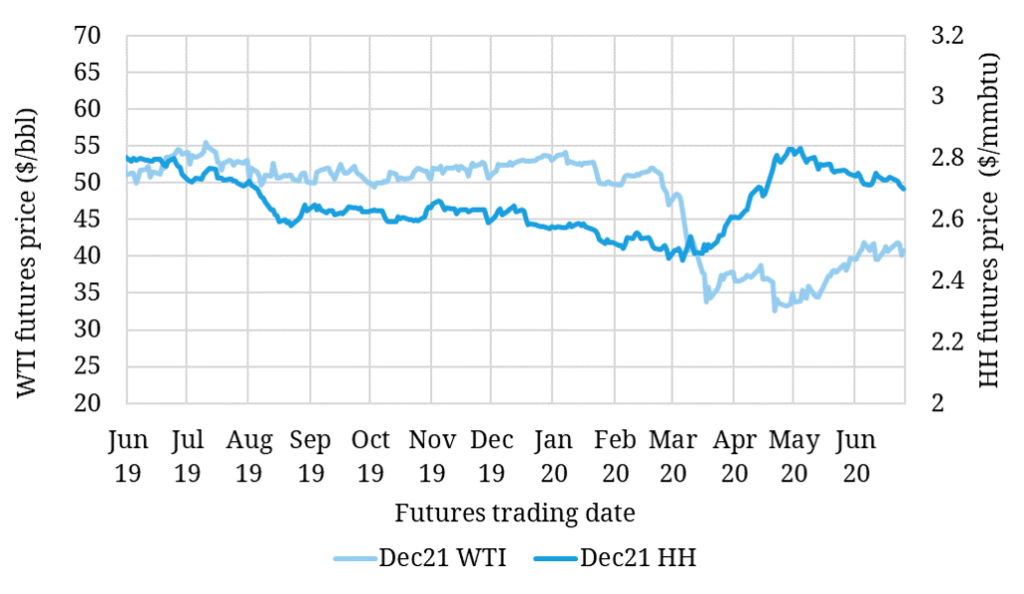
This expected reduction in associated gas supply drove a big rally in Henry Hub futures from Mar-20 to early May-20. The Dec-21 futures contract shown in Chart 4 rose 15% to well above pre-Covid levels. Since early May, forward gas prices have fallen again as crude prices rise, driven by the same associated gas linkage.
The way forward
Gas markets are currently focused on the large swings in spot prices across the current summer. Despite the understandable excitement, the resolution of supply & demand balance issues this summer is not a very useful indicator of what will happen across the next few years.
There is however very useful guidance that can be defined from the level and relationship of forward prices across markets. For example both the relative levels of regional forward prices (Chart 1) and the forward WTI vs Henry Hub relationship (Chart 4).
The influence of Henry Hub on the LNG market and European hub prices is here to stay, given the rapid growth in LNG contract linkage to US hubs. But the role of Henry Hub as primary driver of the global gas market is set to shift. The steep contango in forward TTF and JKM prices into next winter, points to a transition back to Europe (& its power sector) as the LNG market price anchor.
Timera is recruiting
We are expanding our team, given strong growth in demand for our services in 2020. We are looking to recruit Analysts with 1-4 years energy industry experience. For more details and a role specification see Working with Timera. |