Two big years for energy prices
Global commodity prices started a major recovery in Q1 2016. Energy markets played a core role in this recovery. Brent crude doubled in price from 27 $/bbl in Jan 2016 to 54 $/bbl by year end. European coal prices also doubled across 2016 to finish the year at 78 $/t.
Energy prices continued to rise in 2017 with crude up another 23% (to 67 $/bbl) and coal prices up 21% (to 95 $/t) by year end. Gas prices also rose significantly in Europe and Asia, despite healthy volumes of new supply.
Entering 2018, prices rises in energy markets are starting to look stretched from a fundamental perspective. Spot oil and coal prices are above consensus benchmarks for the long run marginal cost (LRMC) of new supply. And gas markets will need to absorb large volumes of committed new supply coming online across 2018-20.
So what are the chances of commodity prices continuing to rise in 2018?
The USD suggests there is more to come
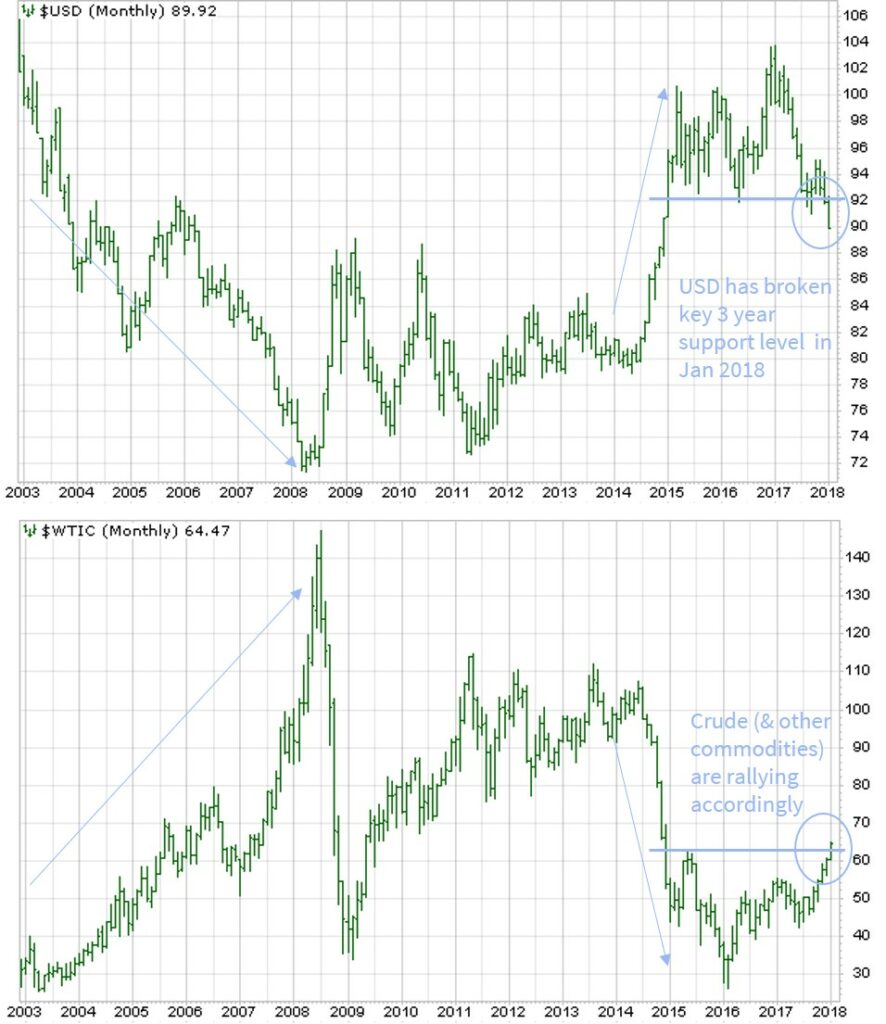
Jan 2018 has seen an important shift in currency markets. The US dollar has declined sharply against other major currencies, breaking out of its three year trading range (from 2015-17). A falling USD may have important implications for energy markets, given the strong negative correlation between the USD and commodity prices.
The USD has historically been an excellent barometer for major commodity price moves. This is illustrated by the inverse relationship between the USD index and crude prices shown in Chart 1.
Correlation does not necessarily imply causation and the drivers behind this inverse relationship are complex. But the historical consistency of the inverse USD vs commodity price correlation means it is worth watching closely.
Chart 1: USD index (top panel) vs front month WTI crude price (bottom panel)

Source: Timera Energy, stockcharts.com
The USD decline is being driven by shifting investor expectations of monetary policy and capital flows. European currencies (EUR, GBP) are rising against the USD, in response to a stronger economic growth outlook and rising inflation expectations. These factors may force European central banks to start to normalise historically loose monetary policies. Capital is also flowing out of the US (weighing on the USD) as economic growth strengthens in Europe, Asia and South America.
Economic growth supports the story
So if a declining USD points to higher commodity prices, is this consistent with the fundamental drivers of commodity markets?
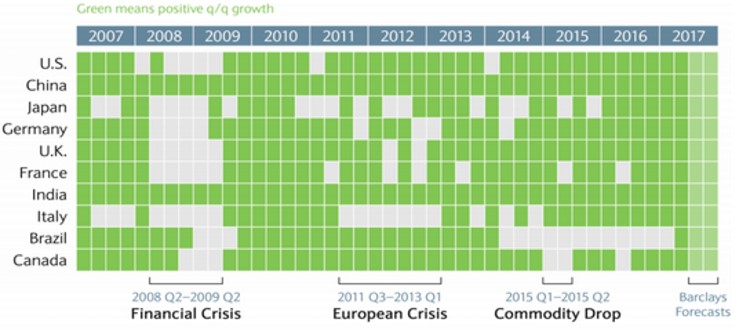
The catch phrase of 2017 was ‘synchronised global growth’. This is illustrated by a wall of green blocks in the 2017 columns of Chart 2 and it is driving higher commodity demand. The last time this synchronisation occurred was back in 2009-10, a period of rapidly rising commodity prices (see Chart 1).
Chart 2: Quarter on quarter GDP growth across major global economies

Source: Doubleline Capital, Haver Analytics, Barclays Research
2017 was dominated by a falling USD and rising commodity prices. So far markets are pointing to a continuation of this trend in 2018.
Commodity markets are notoriously vulnerable to the effects of inelastic short term supply curves. Commodity demand tends to rise more quickly than the ability of supply to respond. Prices rise rapidly as a result until new supply can be brought online. This can lead to curve backwardation and prices rising above the LRMC of new supply.
There is evidence of this dynamic currently in the coal, oil and LNG markets (although there are more temporary seasonal drivers for LNG). Strong Chinese demand is an important factor for all three markets. If the pace of demand growth continues to outstrip supply response this year, commodity prices may continue their upward trend in 2018.


