Wild swings in global gas prices across the last 3 years have greatly increased focus on a simple question: what is it that drives gas price levels?
The answer in the very short term (e.g. the next hour) is market flows i.e. transactions of traders buying & selling gas.
The answer in the very long term (e.g. 10 years+) is there is a loose but powerful influence of the long run marginal cost of incremental supply.
However these simple facts are not a lot of help in supporting commercial & investment decisions. There is a clear benefit from having a more structured framework for understanding the marginal drivers of gas price evolution.
In this article we set out 3 key sources of marginal supply & demand flexibility that act to clear the global gas market and drive the dynamics of Atlantic & Pacific basin pricing benchmarks (e.g. TTF & JKM). These are summarised in Chart 1 and described below.
Chart 1: 3 key sources of flex driving marginal pricing
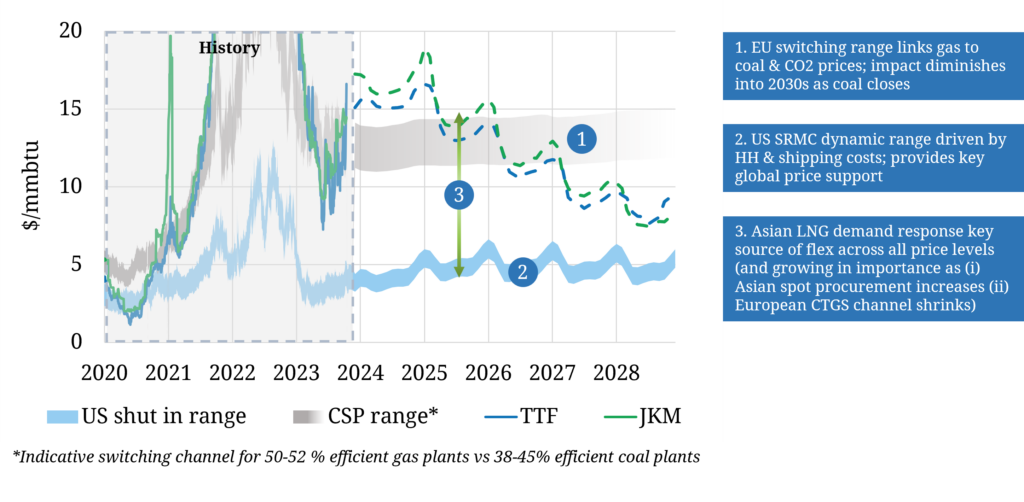
Source: Timera Energy, ICE, CME
1. European power switching
Liquid power & gas markets in Europe ensure the switching of coal for gas plants is a highly price responsive source of demand flexibility. Its influence is important for global pricing not just European.
Despite significant coal closures over the last 5 years, Europe still has a substantial volume of coal capacity, particularly in central and eastern Europe. This supports more than 20 mtpa of power plant switching potential.
The gas price range across which switching occurs is driven by the level of European coal & carbon prices (which in turn drive coal plant relative variable costs). Coal & carbon prices have more than doubled since the start of 2021, materially increasing the Coal Switching Price (CSP) range compared to pre-crisis levels as can be seen in Chart 1.
As gas prices have receded in 2023 from last year’s extreme levels, switching levels have reasserted their influence on TTF & JKM prices, albeit at a higher price range given the increase in coal & carbon prices.
2. Asian demand flexibility
Asia has substantial volumes of price responsive LNG demand, more than 50 mtpa. However the dynamics of demand response are significantly more complex than European power sector switching.
Asian demand flexibility comes from e.g.
- fuel switching in both the power & industrial sectors (e.g. oil & coal for LNG)
- industrial price response (e.g. reducing petrochemical production in response to higher prices in India)
- switching of pipeline gas for LNG e.g. in China.
These mechanisms combine to drive a clear inverse relationship between price & demand as shown in Chart 2.
Chart 2: Asian LNG demand vs JKM prices
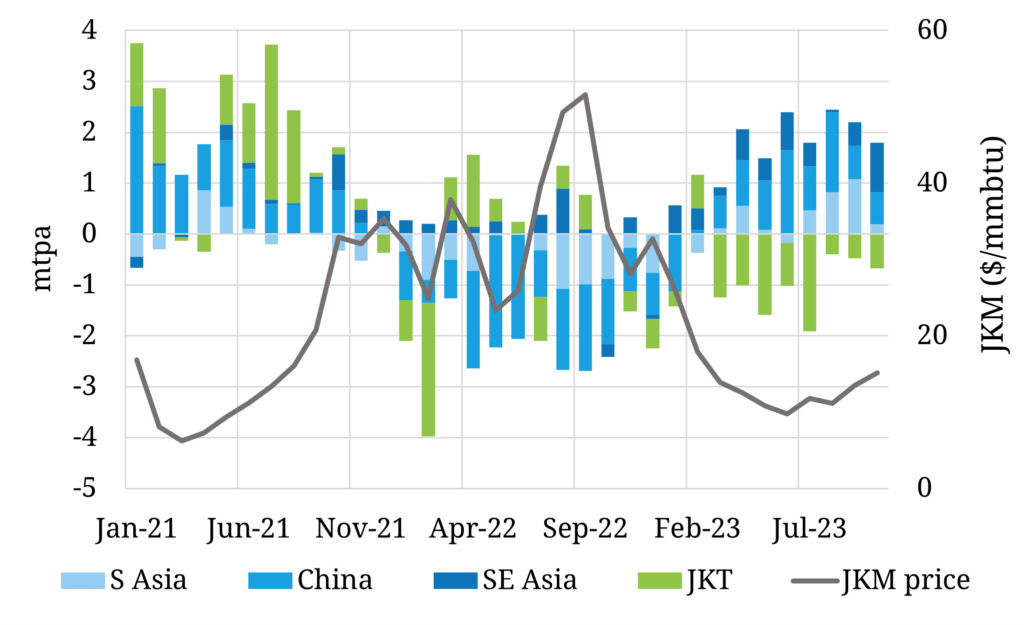
Source: Timera Energy, CME, LNG Unlimited
Asian sources of demand flexibility are typically less price responsive than European power switching. Response is also often lagged relative to price changes.
Complexity is not an excuse to shy away from understanding the impact of Asian demand flexibility. As European coal plants continue to close the importance of Asian price response is rapidly growing and is likely to play a dominant role setting LNG market prices in the 2030s.
3. North American export SRMC
The third key source of marginal price setting flexibility is on the supply side. More than 100 mtpa of LNG supply trains across US, Canadian & Mexican terminals can be ‘shut in’ if netback prices fall below the Short Run Marginal Cost (SRMC) of production.
In contrast, most sources of non North American LNG supply are very inelastic. Once investment costs have been sunk, export terminals run at or close to max output regardless of price.
The key driver of the SRMC of North American supply is US gas hub prices (which drive feedgas costs), the most liquid of which is Henry Hub.
The influence of US export SRMC and Henry Hub on global gas prices is at its strongest in well supplied LNG market regimes. US cargo cancellations effectively act as an oversupply relief valve.
TTF & JKM prices naturally gravitate to a transport cost spread above Henry Hub in a well supplied market, even if there are only very low volumes of actual cargo cancellations.
Putting the pieces together
There is typically a dynamic interaction between two or more of these three key sources of marginal price setting flexibility. For example, European power switching levels are currently exerting a strong influence on TTF & JKM forward curves, at the same time that Asian demand response is also playing an important role (as shown in Chart 2).
The current tight market regime has seen divergence of TTF & JKM from Henry Hub, reducing the influence of US supply flex and US hub price signals. But as the next wave of new LNG supply ramps up in 2025-26, the influence of Henry Hub is set to grow substantially.
There are also structural forces that are likely to impact the relative influence of the 3 key sources of flexibility. For example:
- An ongoing erosion of European power switching response as coal plants close, particularly into the 2030s
- The increasing importance of Asian demand flexibility as developing economies grow and flexibility mechanisms become more responsive to prices (e.g. more dynamic switching).
We provide a deeper dive analysis, quantifying the impact of these flexibility drivers on pricing dynamics, in our latest Global Gas Report. Reach out if you would like a sample copy (details below).
Timera Global Gas Subscription Service
We have recently launched a quarterly Global Gas Service. Contact us (below) if you want a free sample copy of our latest Global Gas Report.
The service includes:
- Comprehensive quarterly projection dataset & chartbook
- Detailed slide-based reports
- Direct access to our experts
For more details see our brochure here.
You can contact David Duncan – Gas & LNG Director (david.duncan@timera-energy.com) for further details.