Time for a simple thought experiment. If you had a ‘one shot’ chance to gaze into a crystal ball and see the evolution of one energy market driver over the next two years, what would you choose?
European gas pricing dynamics would be at the top of our list.
Despite rapidly declining hub prices in 2019, a nascent recovery in the value of gas supply flexibility is taking place, as seasonal price spreads and spot price volatility recover. But hub price evolution is not just important from the perspective of the European gas market.
European gas pricing has an extended influence across other markets and value chains. For example:
- Global LNG supply: LNG pricing in a well-supplied market is currently being driven by TTF. So European gas price levels will have a strong influence on FID decisions for new supply projects shaping the next wave of LNG supply into the mid 2020s.
- Coal plants: Low hub prices in 2019 have driven coal plant cashflows deep into the red across Europe. If this environment continues into 2020-21, it may cause the accelerated economic driven closure of large volumes of European coal plant capacity.
- Renewable investment: Merchant renewable investment is in the early stages of evolution in Europe (e.g. solar projects in Spain). Cost declines are one factor, but power price levels have become a much more important revenue driver. Gas hub price levels are now the primary driver of power prices across Europe and will be an important factor determining how fast merchant renewable investment gathers pace.
Alas we have no crystal ball. So instead, in today’s article we consider 5 key drivers likely to shape the evolution of European gas pricing dynamics.
The recovery versus ‘snowplough’ question
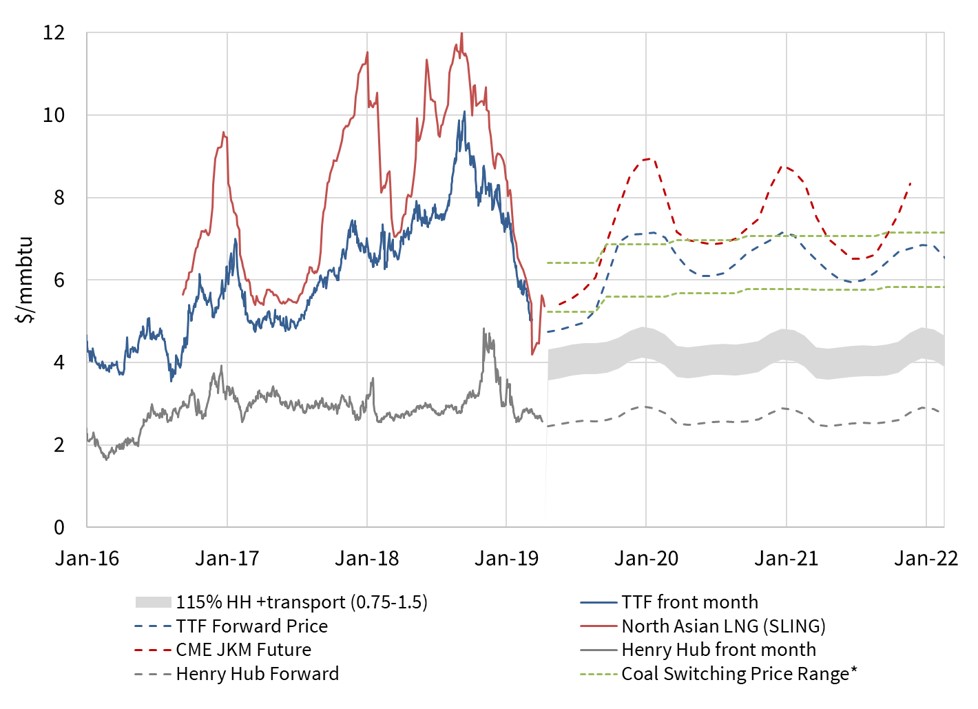
Some unusual and interesting price dynamics have been evident in the European gas market in 2019. Spot hub prices have been in a relentless decline across the first half of 2019. This sits in stark contrast to the steep rise in prices across the first part of 2018, as can be seen in Chart 1.
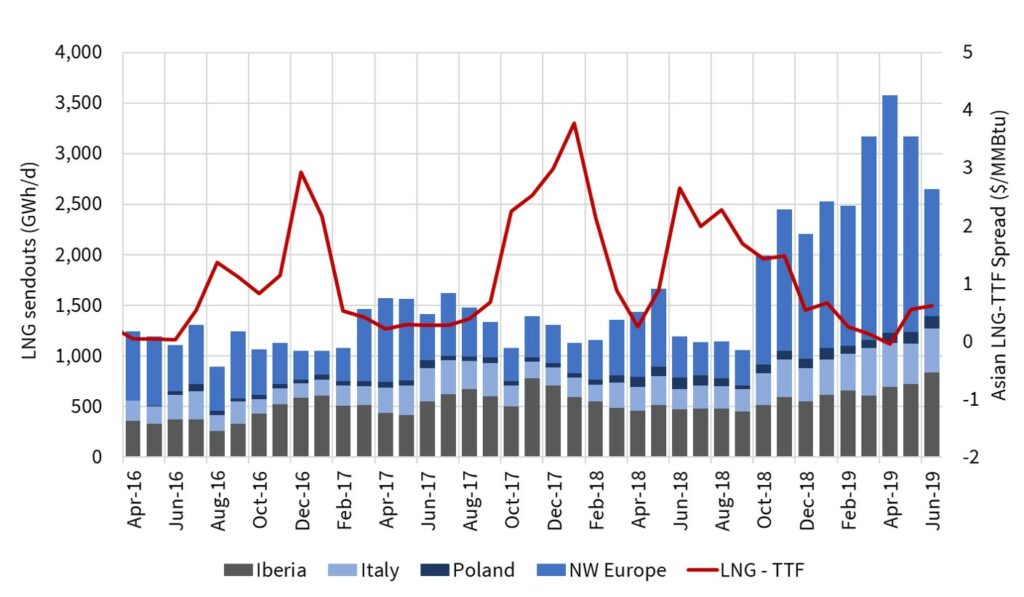
The primary factor explaining the difference between the path of hub prices into summer 2018 vs summer 2019 is the LNG market. 2018 saw flexible LNG diverted from Europe to meet robust Asian LNG demand. In 2019 a pronounced temporary oversupply in the global LNG market has seen surplus cargoes flooding into Europe.
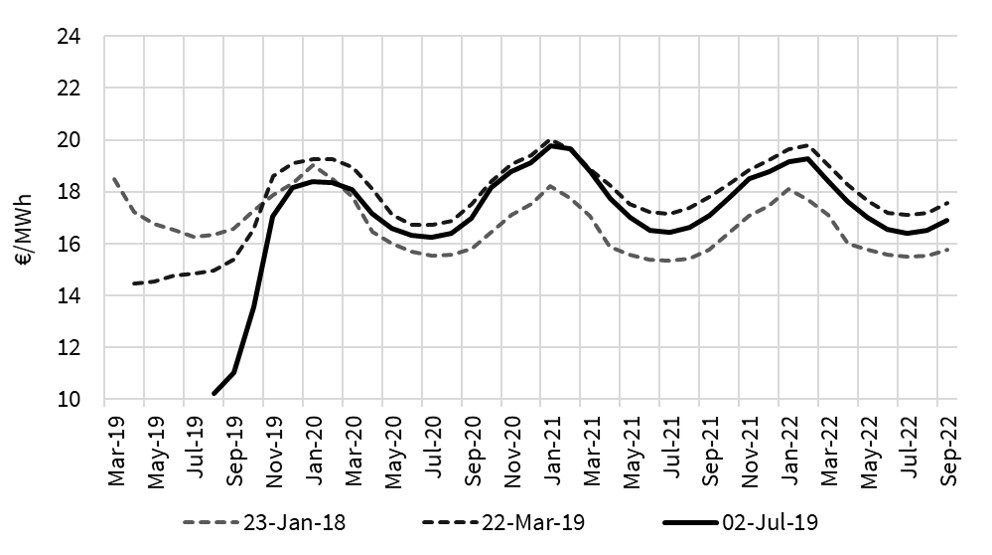
If you consider the TTF forward curve to be the closest thing we have to a crystal ball, curve shape is consistent with a sharp recovery of prices into the coming winter. But as 2019 has progressed, the front of the forward curve has steadily been pushed lower (at least until the beginning of July which we will come to in a minute). Think of a snowplough steadily cutting into a bank of snow.
Summer 2019 prices started the year above 16 €/MWh. By the beginning of Jul-19 prices had fallen almost 40% to 10 €/MWh as shown in Chart 2.
As Sum-19 prices have fallen at the front of the curve, an ever steeper spread has opened up to Win-19. The market has been pricing in an acute but temporary oversupply of gas across the current summer.
This is the result of surplus LNG flowing into Europe, unusually low storage injection demand and falling coal prices (dragging down power sector switching levels). As Q2 progressed, Winter-19 prices also started to show some signs of weakness (see Jul-19 vs Mar-19 curves in Chart 1).
Then last week saw a sharp rebound in European hub prices, with front month TTF now rising more than 25% since the start of July. This move has caught a very bearish market off guard. Prices of other commodities have also moved sharply higher as global central banks have reaffirmed efforts to try and stimulate growth and inflation.
Price moves like this are driving TTF spot price volatility higher in 2019. But is the ‘July jump’ in prices just noise or the start of an enduring recovery into winter and beyond?
We look next at the five factors we think will determine whether European hub prices recover (as suggested by the forward curve) or continue to ‘snowplough’ (as in Chart 2)?
5 key drivers to watch
- LNG demand growth
The strong pick up in surplus LNG flowing to Europe since Q4-18 (shown in Chart 3) is a function of new LNG market supply temporarily outstripping demand growth. Chinese demand continues to grow, although forward contracting has meant Chinese buyers have been less active purchasing spot cargoes. But LNG demand from the rest of the ‘Big 5 Buyers’ club (Japan, Korea, Taiwan & India) is significantly lower in 2019 than 2018. Demand is also down from Latin American and Middle Eastern buyers.
We raised a red flag recently on the potential impact of global economic conditions on gas demand. The trade war appears to be having a particularly strong impact in weakening manufacturing and industrial output. The evolution of LNG demand over the next 1-2 years will be a key factor determining how much surplus LNG will flow into European hubs.
- Ramp up rate of new LNG supply
The other side of the LNG market equation is supply. The highest volumes of new liquefaction capacity from the current supply wave are scheduled to come online across 2019 and 2020. But evidence over the last three years has shown that there is significant uncertainty around project delays and ramp up rates.
A number of other projects commissioned across 2015-19 have experienced up to 12 month delays in reaching full output. There have also been unexpected outages. Seasonal production volume dynamics, where output is significantly higher across the colder northern winters, add to supply side volume fluctuations.
- European power sector switching levels
The main mechanism for the European gas market to absorb incremental LNG flows is coal for gas plant switching in the power sector. This means that European hub prices are influenced by coal and carbon prices.
One of the factors causing downwards pressure on TTF in 2019 has been falling coal prices (carbon prices have remained relatively strong). This has been pulling down the switching range (that we track in Chart 1) across Q2 2019, which in turn weighs on gas hub prices.
The switching range acts as an anchoring point for European hub prices. Spot prices may temporarily deviate from this range, but the TTF forward curve is strongly linked to switching levels. Keep a close eye on the evolution of coal and carbon prices to understand how this switching range evolves.
- European gas demand
European economic growth has slowed sharply in 2019. Manufacturing and industrial output are particularly weak, with Germany leading the decline. The probability of a recession in 2019 or 2020 has risen significantly.
It is unclear:
- how much economic weakness will impact gas demand in Europe and
- how much of this impact is priced into the TTF market forward curve (recognising growing bearish sentiment across H1 2019).
It is worth keeping an eye on the evolution of European economic growth and gas demand data.
- European pipeline supply
Russian flow volumes to Europe hit a new all time high in May 2019, following on from April’s record LNG import volume. Norwegian import volumes have been strong. There has even been a slight recovery in North African imports.
Will pipeline imports remain this strong into winter? Gazprom has not shown any signs of flow sensitivity to low prices yet in 2019. There is however a heavy maintenance schedule on the NCS across the next two months which will temporarily impact Norwegian flows. Market expectations are for strong flow volumes to continue, but any deviation from this (e.g. Russian pull back or major outages) could have significant price implications.
Implications for value of European gas supply flex
After a tough five years, midstream gas asset value is coming back into focus in 2019. Regas terminal utilisation levels have jumped and pipeline flows have been strong. But the most interesting asset class is gas storage.
Seasonal price spreads in 2019 have surged higher, as the front of the TTF forward curve has declined. More importantly for storage asset value, spreads are recovering further out on the forward curve also. Sum 20 to Win 20 TTF spreads have risen above 2.20 €/MWh, with NBP spreads stabilising above 10 p/th.
TTF and NBP spot price volatility have also been steadily rising across 2019, with the ‘July jump’ in prices adding fuel. Conditions of higher volatility and spreads are typically associated with periods of market tightness and rising prices. It is an encouraging sign for storage capacity value that price signals are recovering despite the well supplied, low price environment.
We will be taking our usual summer break from feature articles until mid August. In the meantime we will continue to publish material via our Snapshot and Angle columns on the Blog Home page.