Carbon prices have hit 50 €/t. Winter 21 prices for German power are pushing 70 €/MWh. Winter prices for TTF gas are around 25 €/MWh (8.75 $/mmbtu), with JKM at 10.50 $/mmbtu. These levels reflect an explosive rally underway in the energy price complex.
“These levels reflect an explosive rally underway in the energy price complex.”
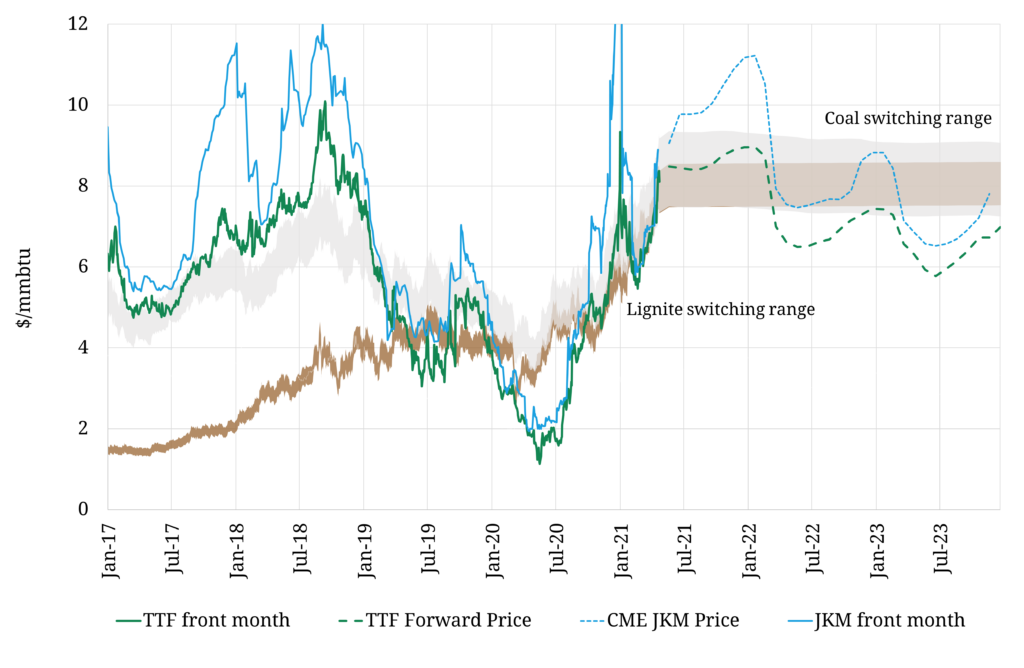
We are going to keep it short and sweet this week and let one of our key charts do the talking.
Chart 1 shows the impact of surging carbon prices in pulling coal & lignite plant switching ranges higher. Rising switching levels are dragging up the TTF gas curve, pulling European power prices & Asian LNG prices higher with it.
The dynamics in play behind surging prices can be broken down into 4 main drivers.
1.Carbon prices
The single most important driver of higher European gas & power prices in 2021 is rising carbon prices. This is acting to pull both hard coal and lignite switching levels higher. Rising switching levels translate directly into higher European gas hub prices, with power prices following suit.
The higher the carbon price has risen, the more influential lignite switching has become. A 1 €/t move in the EUA price causes around a 0.45 €/MWh move in the lignite switching range compared to a 0.25 €/MWh for the coal switching range.
Chart 1 shows the front of the TTF curve sitting near the top of the lignite switching band. That means each €/t move higher is having almost double the impact on TTF vs the hard coal switching mechanism we are used to.
2.Russian & Norwegian supply
Europe’s two big pipeline gas suppliers are not responding to surging hub prices. European gas demand has been running at 5 year highs in 2021, so a lack of pipeline supply response is helping support prices.
Russian flows via the Ukraine route fell sharply into 2020 as the new transit agreement came into force. This drop also came against a backdrop of very low hub prices. Russian flows across this route started to rise again in Q4 2020 as TTF prices recovered, but have fallen back again in 2021.
Gazprom’s flow decisions are not a simple price / volume optimisation problem. A rapidly tightening European gas market is a convenient backdrop for Gazprom to apply political pressure on the EU (& Germany in particular), in order to ensure Nordstream 2 comes into operation.
Norwegian production has been relatively low in Q2 2021, with Norway engaging in major maintenance early this year. Production in the Netherlands is also ramping down fast with the giant Groningen field on track to close by mid 2022.
3.Asian LNG demand
Strong Asian LNG demand is important for European gas & power markets, as it results in the diversion of flexible LNG supply. This has been a theme of 2021 as Asian economic growth & gas demand recovers strongly, particularly in China.
After the fireworks of January 2021, Asian LNG demand cooled into March. But there is mounting evidence of a resurgence in Asian demand through the summer. The JKM forward price premium over TTF is rising, with netbacks for US LNG exports favouring flows to Asia. The time charter market is also tightening again (with rates back above 70k $/day), signalling a stronger pull for LNG from Asia.
European gas demand is strengthening against a backdrop of supply volume weakness across both pipeline and LNG imports.
4.European storage balance
European gas storage levels are low coming into the summer injection season. A blast of cold weather in April has seen aggregate storage inventories fall to around 30% full, versus 60% last year and a 40% 5yr average. Low Norwegian supply due to early maintenance has contributed to strong storage withdrawals.
These dynamics have caused an unusual shape in the TTF forward curve. May 21 has been pricing well above the summer months, reflecting an immediate demand for gas, prolonging the storage withdrawal season. Low storage inventory levels will support strong summer gas demand for injections to replenish stocks, another factor lifting the TTF curve.
What happens next?
Chart 1 shows an unusually sharp drop in the TTF forward curve from 2021 to 2022, resulting in a similar dynamic with the JKM curve. It costs a lot more to buy gas for delivery in 2021 compared to 2022.
We wrote a lot about the ‘snow plough’ effect in 2019-20, where low spot prices continued to drag forward curve prices lower.
Watch out for the opposite in a structurally tightening global gas market. Curve backwardation in commodity markets is often bullish. It may be the back of the TTF forward curve that will be dragged up by higher near term prices as 2021 progresses.