2019 has seen a big shake up in the European gas market supply and demand balance. In today’s article we use 5 charts to summarise the current state of play.
These charts cover forward pricing, LNG imports, Russian flows (& looming disruption), storage inventories and power sector switching.
The aim of the charts is not just to review what has happened in 2019, but to think about what may be coming next. Welcome aboard the 5 chart tour!
Snowplough continues to flatten spot prices
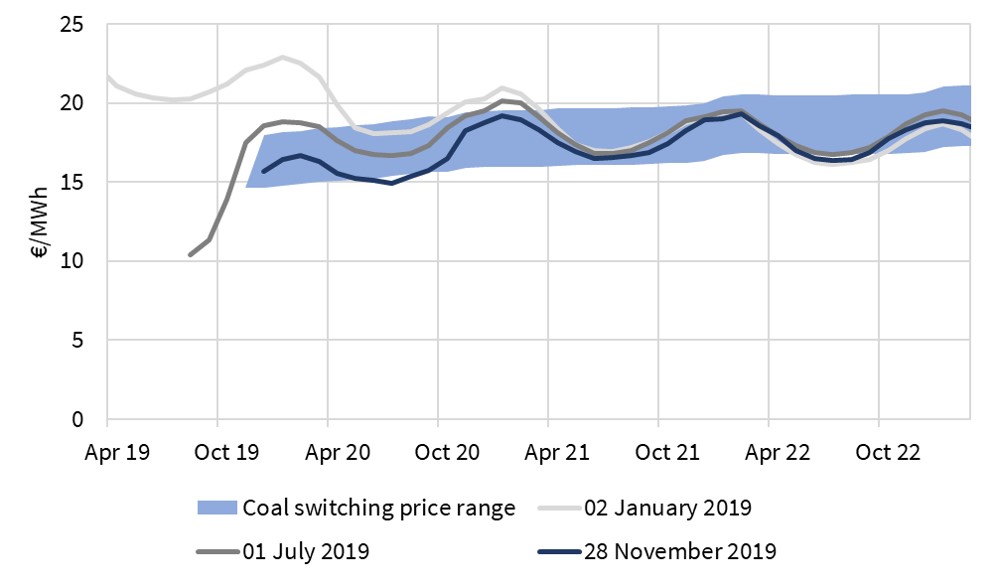
As 2019 has progressed, the front of the TTF forward curve has steadily been flattened by an ongoing surplus of gas. The impact of falling prices at the front of the curve can be seen in Chart 1. We wrote an article describing this ‘snowplough effect’ in July.
Chart 1: TTF forward curve evolution & current switching range
Source: Timera Energy, ICE
The back end of the forward curve has been relatively stable in comparison, anchored by the gas for coal plant switching price range which we have added as a shaded overlay on Chart 1. However as 2019 has progressed, the expectations for a continuing global surplus of LNG have extended into 2020, pulling down forward prices accordingly.
The primary cause of surplus LNG flowing to Europe has been a slowdown in Asian LNG demand growth across the last year. This has occurred against a backdrop of steadily increasing supply from new liquefaction projects. Weaker economic growth and an easing of China’s policy driven fuel switch from coal to gas lie behind this softening in demand.
Surge of surplus LNG to Europe continues
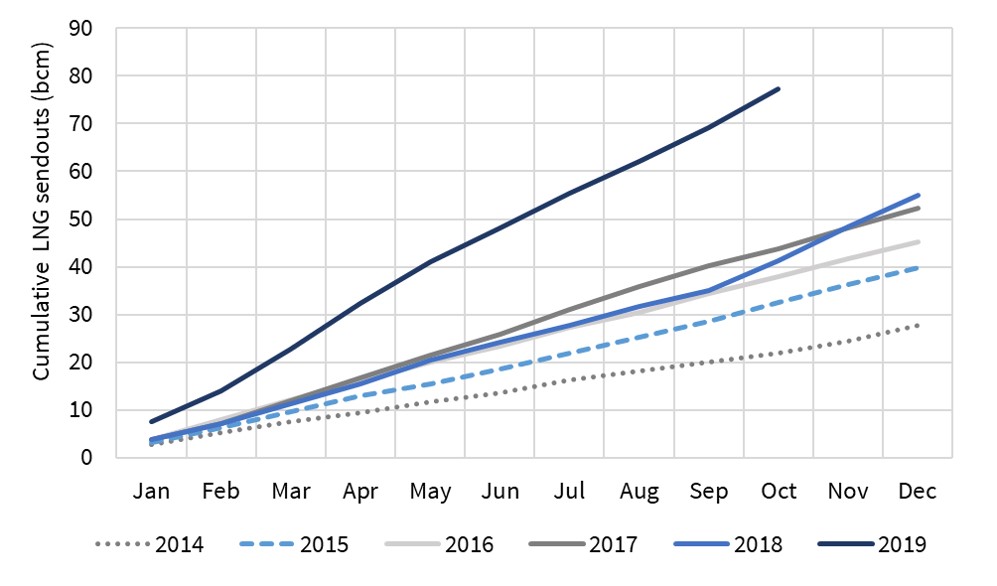
Chart 2 illustrates just how much European LNG import volumes have risen in 2019 compared to the previous 5 years.
Chart 2: European LNG regas terminal send out
Source: Timera Energy, ENTSOG
European LNG import volumes hit an all time record in Apr-19. The pace of imports slowed a little over summer, but has been increasing again in Q4-19. European LNG imports look like they could be 45 bcm above 2018 levels by the end of this year.
High LNG imports to Europe are likely to continue into 2020, with continuing weakness in TTF prices as well as JKM convergence.
Russia has not blinked… but 31st Dec looms
Russia’s annual gas export volumes to Europe hit a record level in 2018. Export volumes in 2019 are only slightly lower, with the difference driven by lower exports to Turkey (via Romania).
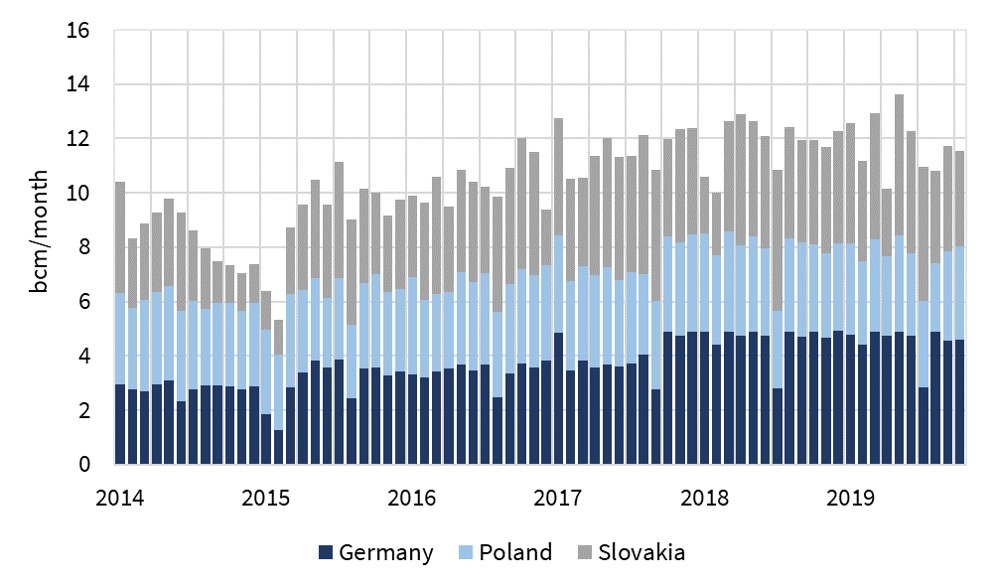
Chart 3 shows Russian flow volumes into Europe across the 3 main export routes. Apart from maintenance periods, Nordstream (into Germany) and Yamal (into Poland) are flowing at full capacity. The Ukraine/Slovakia route remains Gazprom’s ‘swing route’, but has also been flowing at high utilisation levels.
Chart 3: Flow volumes on the 3 key Russian export routes into Europe
Source: Timera Energy, ENTSOG
However high Russian flow volumes could change from 31st Dec this year. Russia/Ukraine transit agreement talks look increasingly likely to result in a supply disruption from year end when the current agreement expires. The length of any disruption could have an important bearing on market balance.
The EU and Ukraine want a new 10 year deal to underpin a firm flow arrangement going forward. In contrast, Russia’s interests are focused on retaining flexibility (both over contract volume & length), with a view to maximising flows via alternative northern routes, including Nordstream 2.
The impact of a temporary disruption (e.g. one measured in days) is likely to be dampened by a well supplied European gas market. But if the disruption extends into weeks or even months, it will mean a material reduction in pipeline supply into Europe. That will start to impact price levels and volatility, particularly if it’s a cold winter.
Storage inventories remain high
The other factor that may help dampen any shorter term Ukraine route disruptions is very high levels of storage inventory. Ukraine has higher volumes in store than usual in preparation for Russia turning off the taps. And Chart 3 shows aggregate European storage volumes are currently at a record high.
Chart 4: Pan-European storage inventory levels (2013-19)
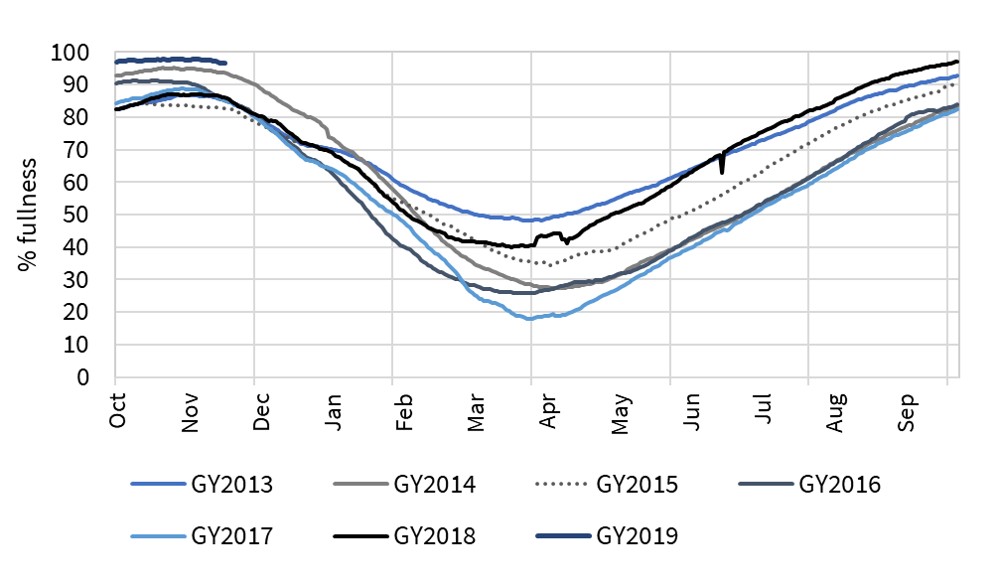
Source: GIE
The cumulative impact of high LNG flows, high Russian imports and high storage inventories is lower hub prices. Price responsive demand to absorb surplus gas is focused on the power sector.
Power sector driving marginal hub prices
Residential and industrial gas demand is relatively price inelastic in the short term. This leaves the power sector providing flexible response and therefore driving marginal hub prices at TTF (& its satellite hubs). Chart 5 shows where most of the increase in power sector gas demand is coming from.
Chart 5: Gas-fired generation across key power markets
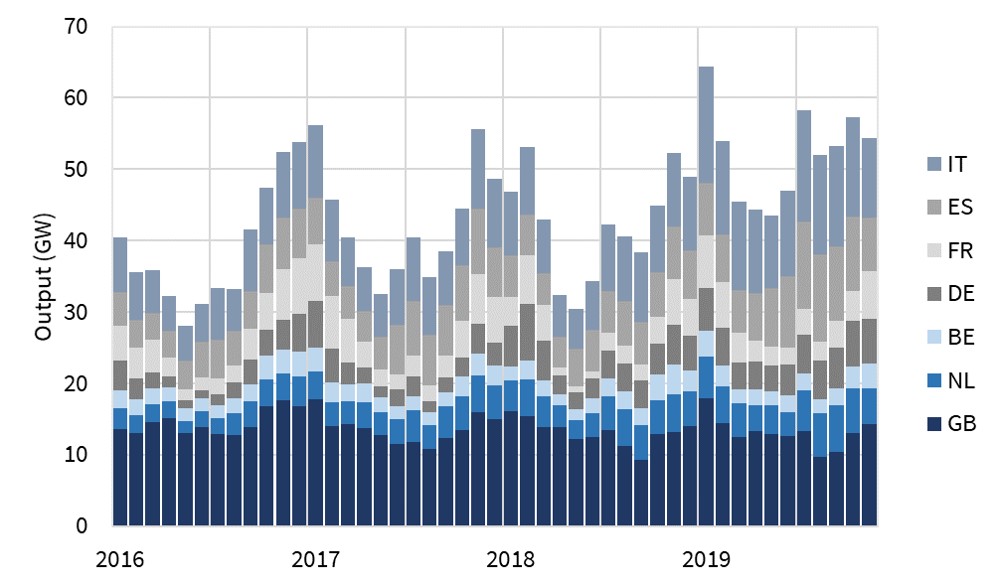
Source: Timera Energy
Germany, Spain, Italy & The Netherlands are the key European power markets with underutilised gas plant capacity. As spot prices have remained weak across 2019, CCGTs have continued to run at high load factors and displace coal units (often in neighbouring markets e.g. NL gas switching DE coal).The very low TTF spot prices we have experienced across periods of Q3 and Q4 2019 (e.g. below 10 €/MWh) have been caused by prices needing to fall to a level that incentivises higher variable cost gas-fired plants to run (e.g. low efficiency CCGT and the higher cost flex tranches of CHP units). These downward ‘lurches’ in price have helped support a recovery in TTF volatility in 2019.
What changes the current picture?
The key shift in gas market expectations across 2019 can be summarised as ‘lower prices for longer’. Consensus view at the start of this year was that surplus gas was a within-year problem. As the year draws to a close, the conditions described above look set to extend well into 2020.But gas markets are famous for springing surprises (e.g. the shift from drought to flood across Q3-Q4 2018). So we finish with 5 factors that could change the current balance:
- LNG demand recovery: A 2020 Asian LNG demand recovery e.g. as we saw in 2016 after a weaker 2015
- Economic recovery: a broader recovery in European & Asian economic growth and gas demand e.g. driven by an easing in US – China tariff tensions
- Ukraine: A major Ukraine route supply disruption if transit agreement talks break down
- Cold: A cold northern winter, driving Asian LNG & European gas demand recovery
- Outages: Major supply disruptions e.g. new LNG project ramp up issues or Nth Sea outages.
In the absence of one of these, market rebalancing may depend on roll off of the current wave of new LNG supply projects from 2021.