The TTF forward gas curve was trading under 5 €/MWh last summer when we published an article setting out our thesis on a major gas & power price rally.
“By any measure this is the fiercest rally in the history of the European gas market… and European power prices have followed suit.”
“As worries about negative European gas prices increase, we set out why both gas & power prices may be on the brink of a sharp and structural rally.” Timera Energy Jun 8th 2020
2021 forward prices hit 48 €/MWh early last week. That is a 1000% rise in forward gas prices in just over a year.
By any measure this is the fiercest rally in the history of the European gas market. And European power prices have followed suit, propelled higher by surging gas and carbon prices.
A combination of low LNG imports and weak Russian flow volumes has seen the European gas market disconnect from its power sector switching range anchor levels over the last two months. Strong demand has been ramping up an inelastic (price insensitive) supply curve, driving prices higher.
In today’s article we use 5 charts to show what is going on. We also set out why the rally may be running out of steam, with the potential for significant price declines into winter.
Strap in for the chart based show.
1. Switching levels are surging with coal & carbon prices
Any understanding of European gas market pricing dynamics starts with power sector switching levels. As coal and carbon prices rise gas hub prices need to follow if the competitive balance between gas & coal plants in the power sector is to be maintained.
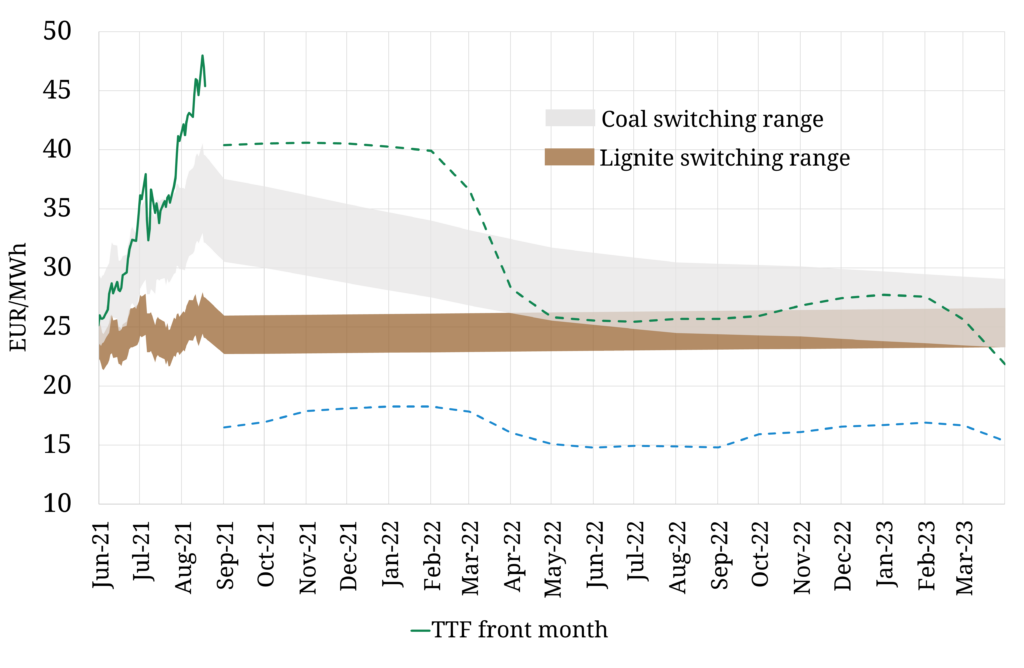
Chart 1 shows how TTF prices have increased in sympathy with rising switching ranges as coal & carbon prices have surged.
Chart 1: Front month TTF prices vs coal & lignite switching ranges

Source: CME, ICE
Carbon EUA prices are up 60% since the start of the year. Rising carbon prices were the primary driver pushing both coal and lignite switching ranges higher across Q1 and Q2.
ARA coal prices are up over 100% since the start of the year, with most of these gains occurring since May. This has caused the coal switching range to diverge from the lignite switching range across the last 3 months, pushing TTF prices higher as it goes.
It has been particularly impressive across this summer that the rise in TTF has outpaced the increase in coal switching range level. Coal & lignite plants are now structurally cheaper than gas in European power market supply stacks and gas prices have continued to rise.
The most recent surge in TTF across the last month is the result of marginal pricing being driven by expensive switching tranches (e.g. CCGT CHP tranches & less efficient gas plants) and ultimately by LNG demand destruction in Asia.
2. Asian demand is pulling LNG from Europe
European gas demand is at its highest level in 5 years. At the same time European LNG import volumes have been relatively low in 2021 and declining sharply since May, as shown in the left hand panel of Chart 2. This is a significant factor contributing to gas market tightness.
Chart 2: North West European LNG import volumes and Asian LNG demand
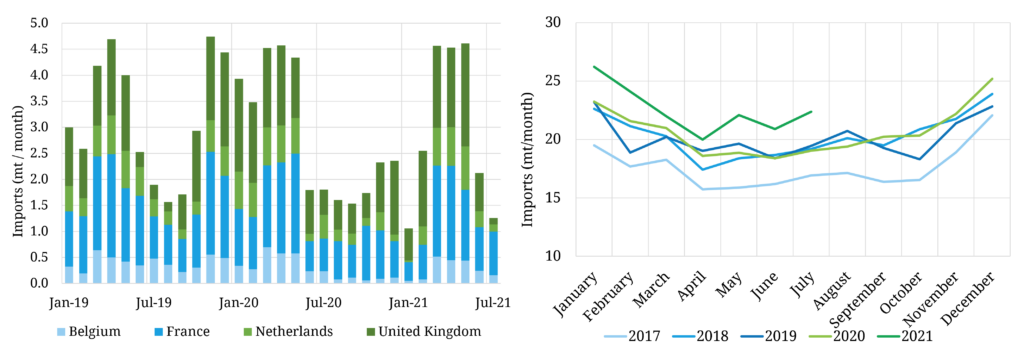
Source: ENTSOG, LNG Unlimited
Falling European import volumes reflect a step change higher in Asian LNG demand in 2021, as shown in the right hand panel. LNG demand growth this year is being led by China, but there has also been relatively strong demand from Brazil given the impact of drought conditions on hydro power production.
European LNG import volumes have fallen below levels seen in summer 2020, when US shut in volumes were at their peak crimping flows to Europe. Tightness in the LNG market has been an important factor contributing to TTF price rises.
3. Russia has not responded to prices… yet
We’ve covered two major sources of incremental supply volumes so far in power sector switching and LNG. The third major source is Russian imports and Chart 3 shows how in 2021 Gazprom’s supply volumes have not responded to surging prices (although it should be noted that there have been some incremental flows into Turkey this year that are not shown on this chart).
Chart 3: Russian gas import volumes into Europe via 3 major flow routes
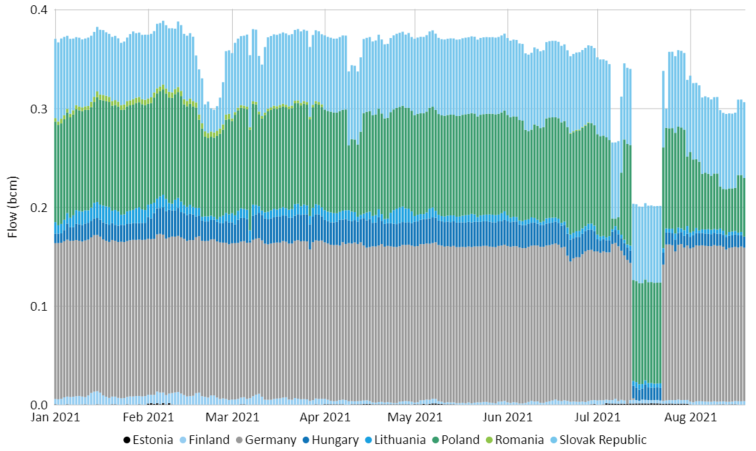
Source: ENTSOG
Maintenance on both the Nordstream 1 and Yamal pipelines across the last two months have seen substantial declines in Russian import volumes, exacerbating gas market tightness in Jul & Aug.
There are several factors in play behind Gazprom’s lack of price response in 2021:
- Strategic considerations around the approval of Nordstream 2
- Relatively tight gas conditions within the domestic Russian market
- Unwillingness to increase flows across the Ukraine & Polish routes (e.g. due to higher short term capacity costs)
Nordstream 2 however has the potential to have a major impact on Russian flows. Gazprom announced last week it can flow up to 5.6bcm through NS2 this year, although a significant portion of that would likely displace Yamal route volumes. As Putin met with Merkel last Fri, it was clear that Russia has a strong hand in pushing for NS2 commissioning, particularly with the approaching winter stoking fears of further gas price rises.
4. European storage is very tight
2021 has been an unusual storage year, driven to a large extent by TTF pricing dynamics. Chart 4 shows how European storage inventories are well below average coming into winter.
Chart 4: Aggregate European gas storage inventories (inc. Ukraine)
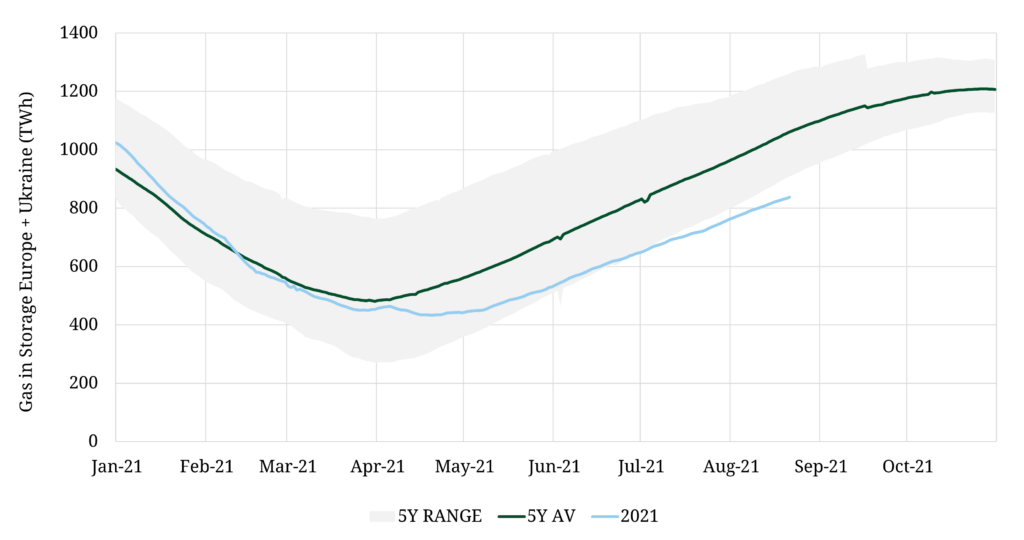
Source: AGSI
Typically storage injections across the summer are incentivised by a forward price premium for winter. This has not been the case for most of this year with a very flat shape to TTF forward prices across 2021.
Forward price shape is acting to slow the rate at which European storage facilities are replenished, with capacity owners looking for any opportunity to buy gas at a discount to winter prices.
In some gas markets (e.g. Italy) there are mandated requirements to fill storage facilities regardless of price, which contributes to the steady rise in inventories seen in the chart. But the European gas market is about to face a winter with a significantly lower storage buffer than normal
5. Back end of the TTF forward curve rising too
Our final chart today looks at the structure of the TTF forward curve vs forward switching ranges.
Chart 5: TTF forward curve vs forward coal & lignite switching ranges
Source: CME, ICE
Many of the dynamics we have described above relate to acute market tightness specifically impacting 2021. This can be seen in the strong backwardation of the TTF forward curve beyond the coming winter. Prices across the next 6 months reflect a strong risk premium relating to uncertainties around Russian supply, LNG market balance and low storage inventories.
However looking beyond 2021, there has still been a structural rally in forward TTF prices this year, as can be seen by comparing the current forward curve to the one from the beginning of January (green vs blue dashed lines). The back end of the TTF curve is firmly anchored within coal & lignite switching ranges.
As things stand that means TTF forward prices are anchored around 25 €/MWh (9 $/mmbtu). Try telling someone that with a straight face back on the 1st of January this year.
Why things could be about to change
TTF prices for this winter fell by about 20% across the middle of last week, before making a significant recovery. Two factors contributed to this decline and they are well worth keeping an eye on:
- Commodity price correction: There was a major price correction across all commodities last week reflecting economic slowdown in China (+ delta variant Covid risk) and the US Federal Reserve signalling it may taper monetary stimulus. Coal & carbon prices fell sharply dragging down switching levels and LNG market pricing also eased.
- Russian import volumes: Gazprom signalled its intention last week to flow substantial Nordstream 2 volumes this year. There is plenty of politics in play here, but if Russia secures the timely commissioning of NS2 it will likely result in incremental supply into Europe across winter.
There is a substantial risk premium priced into the TTF curve across the coming winter as we described above. If this is eroded (e.g. via NS2 flows & recovering LNG imports) at the same time coal & carbon prices undergo a correction, we could see a significant decline in Winter 2021-22 TTF prices. Power prices would of course follow suit in that scenario.
However any price correction in the front of the TTF curve needs to be considered in the context of what was a structural turning point in energy markets last summer. The long term fundamental drivers behind tightening European gas & power markets remain firmly in place. That is why forward curves are rising. The chances of seeing the TTF curve under 5 $/mmbtu again this decade are looking pretty slim.
