“LNG market shifts are rewriting the volatility & correlation rulebook.”
Global gas price volatility & correlations are firmly in focus given the ongoing Middle East supply shock.
Price volatility and correlation are two of the most commercially important signals in both gas & power markets. ‘Volatility’ measures how uncertain or variable prices are – shaping the range of market or asset value outcomes. ‘Correlation’ of price returns measures how different price series move relative to each other e.g. whether two markets move together or diverge.
Both matter beyond pure risk management. Volatility and correlation are fundamental drivers of the value of energy market flexibility – e.g. supply flexibility, storage, portfolio optionality – and are core inputs into the models used to quantify and manage that value. Getting them right is not a theoretical exercise; it directly shapes investment and commercial decisions.
In today’s article we set out how to quantify volatility & correlation. We also show a practical TTF vs US Henry Hub price correlation case study & 5 commercial takeaways.
Although we focus on LNG & gas price examples in this article – we apply a very similar approach to power prices.
Historical vs. implied: the measurement challenge
The conventional approach is backward-looking: measure volatility and correlation from historical price data. Simple, but limited. History provides useful context but is often a poor predictor of the future. In energy markets – where the fundamental landscape is in constant evolution – history is rarely an accurate guide.
The gold standard is to imply volatility & correlation metrics from traded options prices, where market participants are effectively pricing future uncertainty in real time. But options markets for LNG and gas remain illiquid and patchy, limiting this approach in practice.
This leaves a gap: historical estimates lack forward relevance, while implied metrics lack data availability. There is a third option.
A third way: fundamental projection
At Timera, we have developed a suite of stochastic market models designed to directly address this challenge. The approach has two steps: first, a rigorous characterisation of underlying market uncertainties; second, a realistic representation of market clearing and price formation that translates those uncertainties into simulated price outcomes.
This enables us to quantify fundamentally-implied volatility and correlation – metrics derived from a forward view of how markets are likely to behave under hundreds of simulated market outcomes. These projections are internally consistent with our broader market modelling, producing asset valuations and commercial analysis that are both more robust and more meaningful.
Let’s look at a practical case study.
Case study: TTF to Henry Hub correlation
The chart below illustrates this approach, showing a projection of the distribution of TTF vs Henry Hub correlation of price returns to 2035, set against the historical context.
Chart 1: Projected TTF vs HH correlation
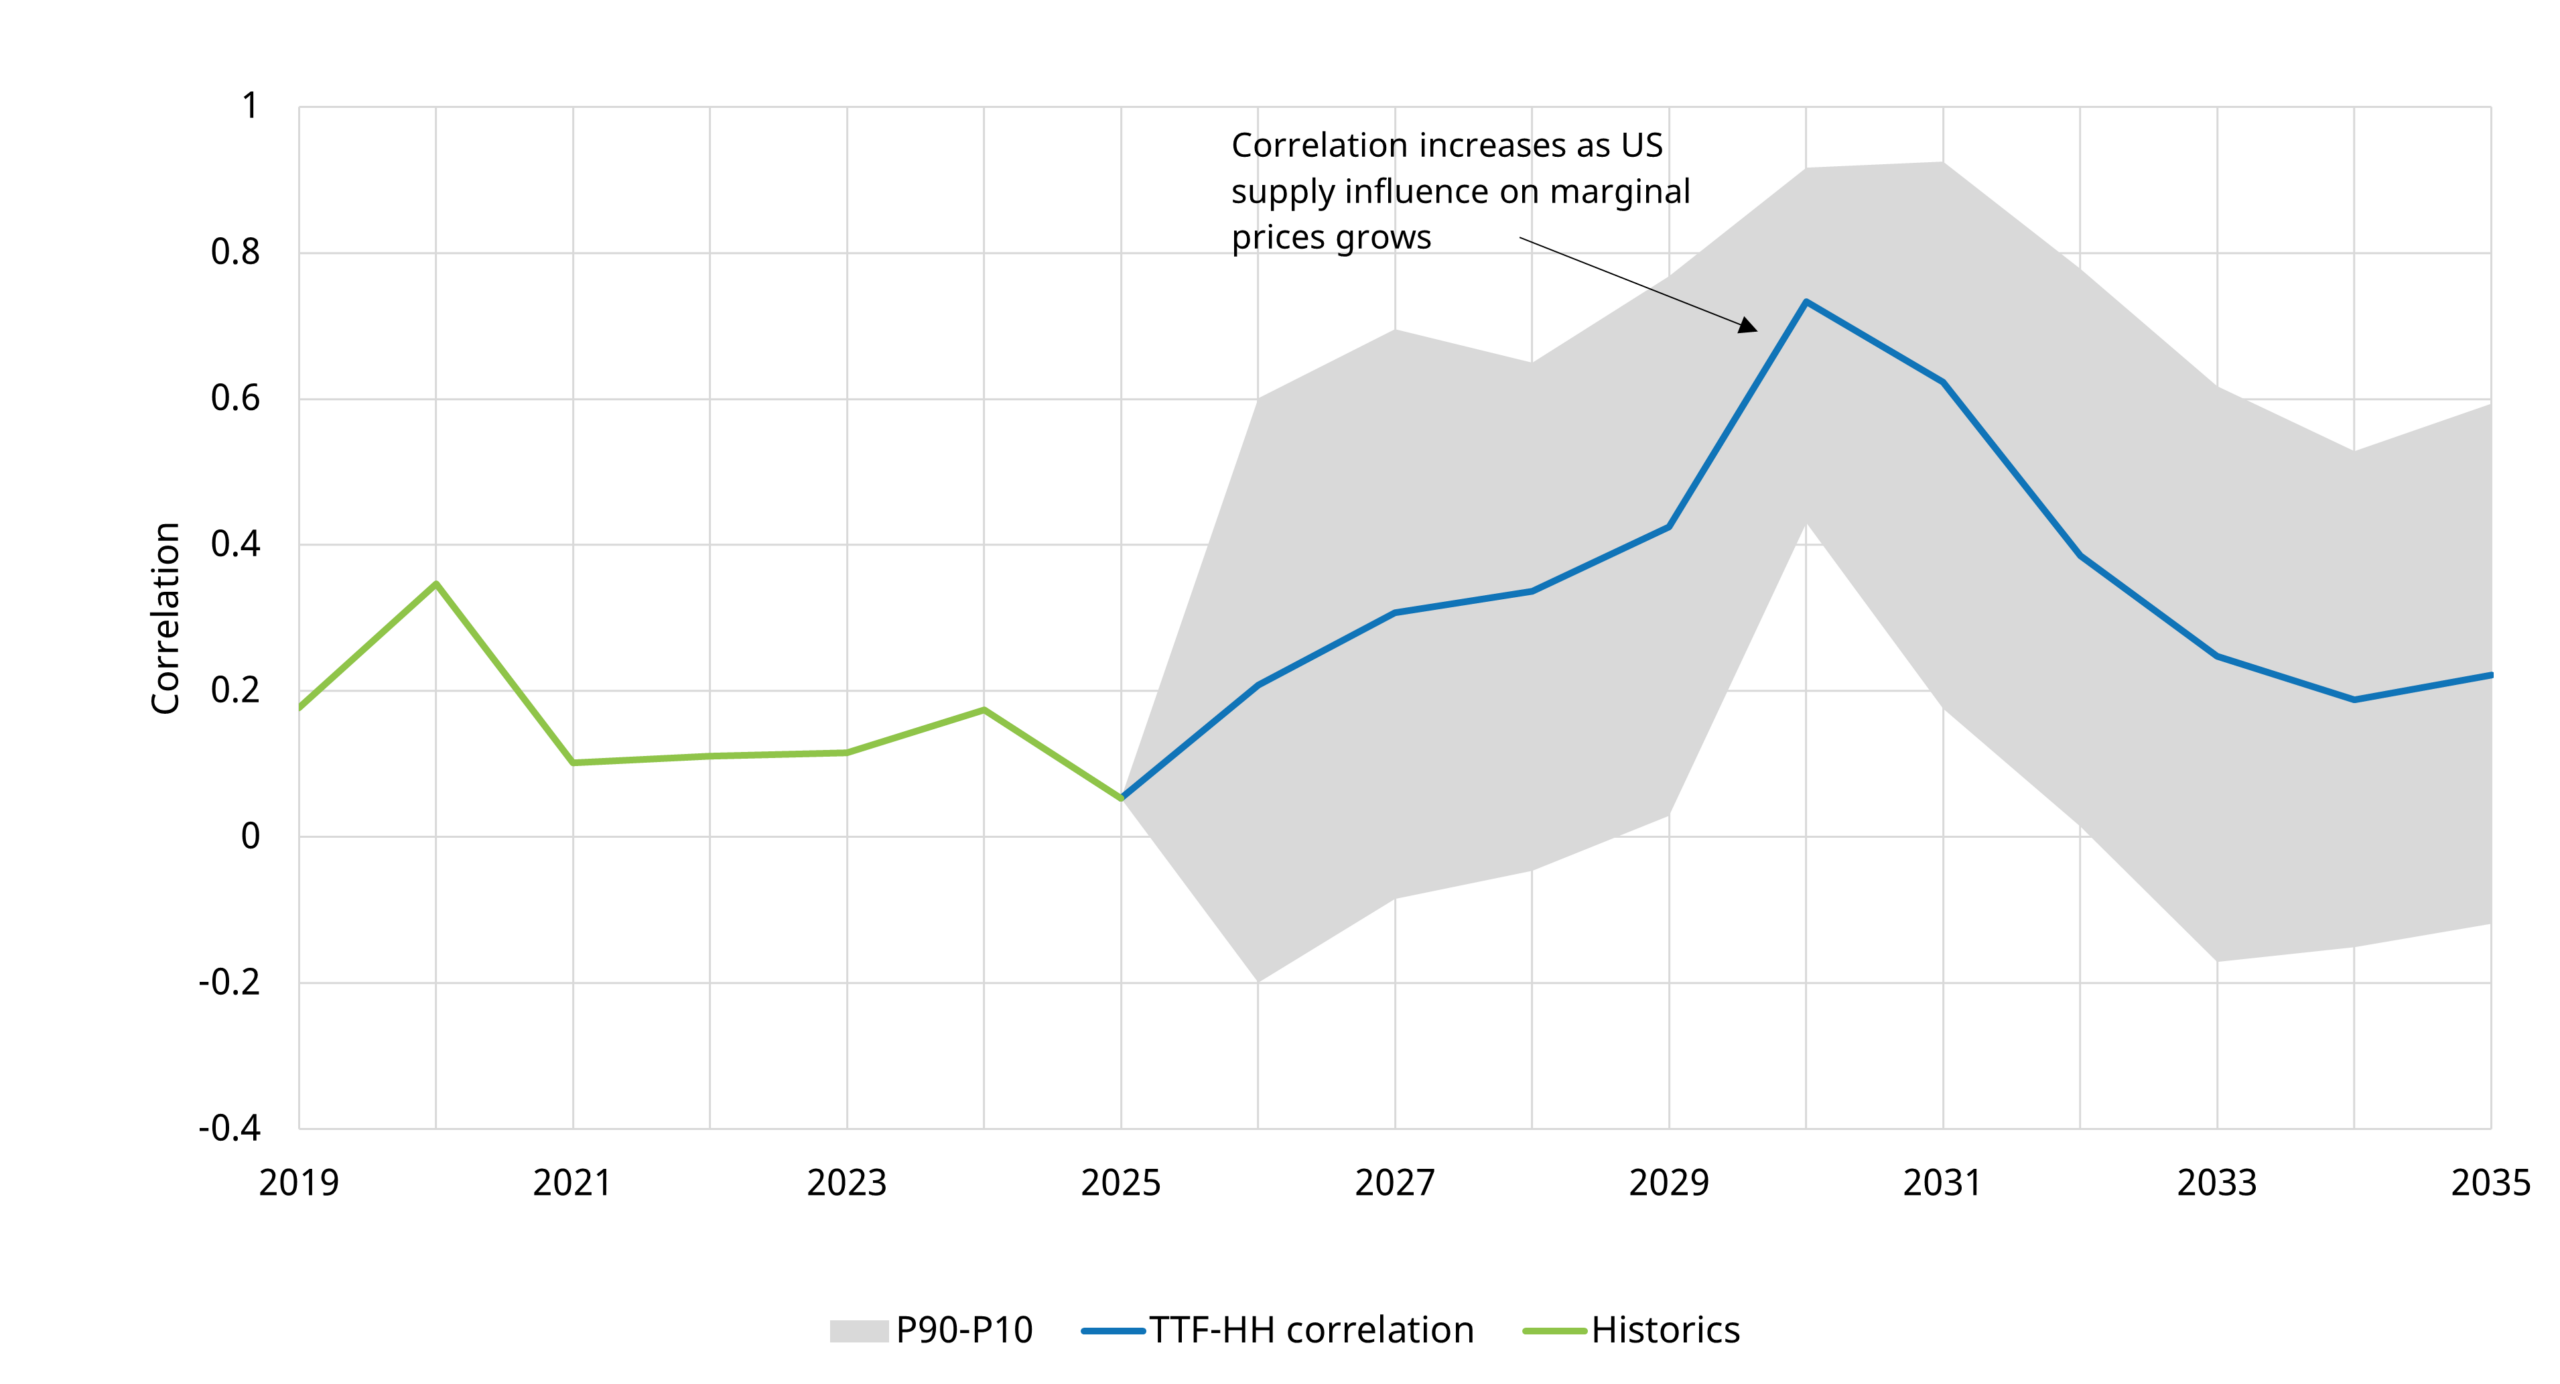
Source: Timera Global Gas Model
We produce the distribution of correlations in Chart 1 by running hundreds of simulations of correlated supply & demand balance and commodity price pathways (e.g. Brent, coal, carbon) through our Global Gas Model. This generates a rich set of data on gas market price levels, volatilities & correlations.
The P10 – P90 percentile range around the average or expected correlation represents how the market uncertainties translate into risk in outturn correlations.
Chart 1 shows HH vs TTF correlation increasing to 2030 as large volumes of new LNG supply come online. This reflects an increase in the marginal price setting role of Henry Hub–linked US LNG exports – impacting both the global LNG market and the European gas market (e.g. TTF).
One point to flag is that more substantial volumes of US cargo cancellation can actually act erode HH vs TTF correlation. This is driven by cancellations acting to (i) push down prices in the domestic US market while (ii) supporting global gas prices.
Our modelling then shows HH vs TTF correlation declining into the 2030s as the LNG market gradually rebalances. This results in a decreasing influence of US LNG on marginal LNG prices and a decline in correlation – this can be seen in Chart 2 via the shift from blue (2030) to green (2035) market balance.
Chart 2: LNG market supply & demand balance 2030 vs 2035
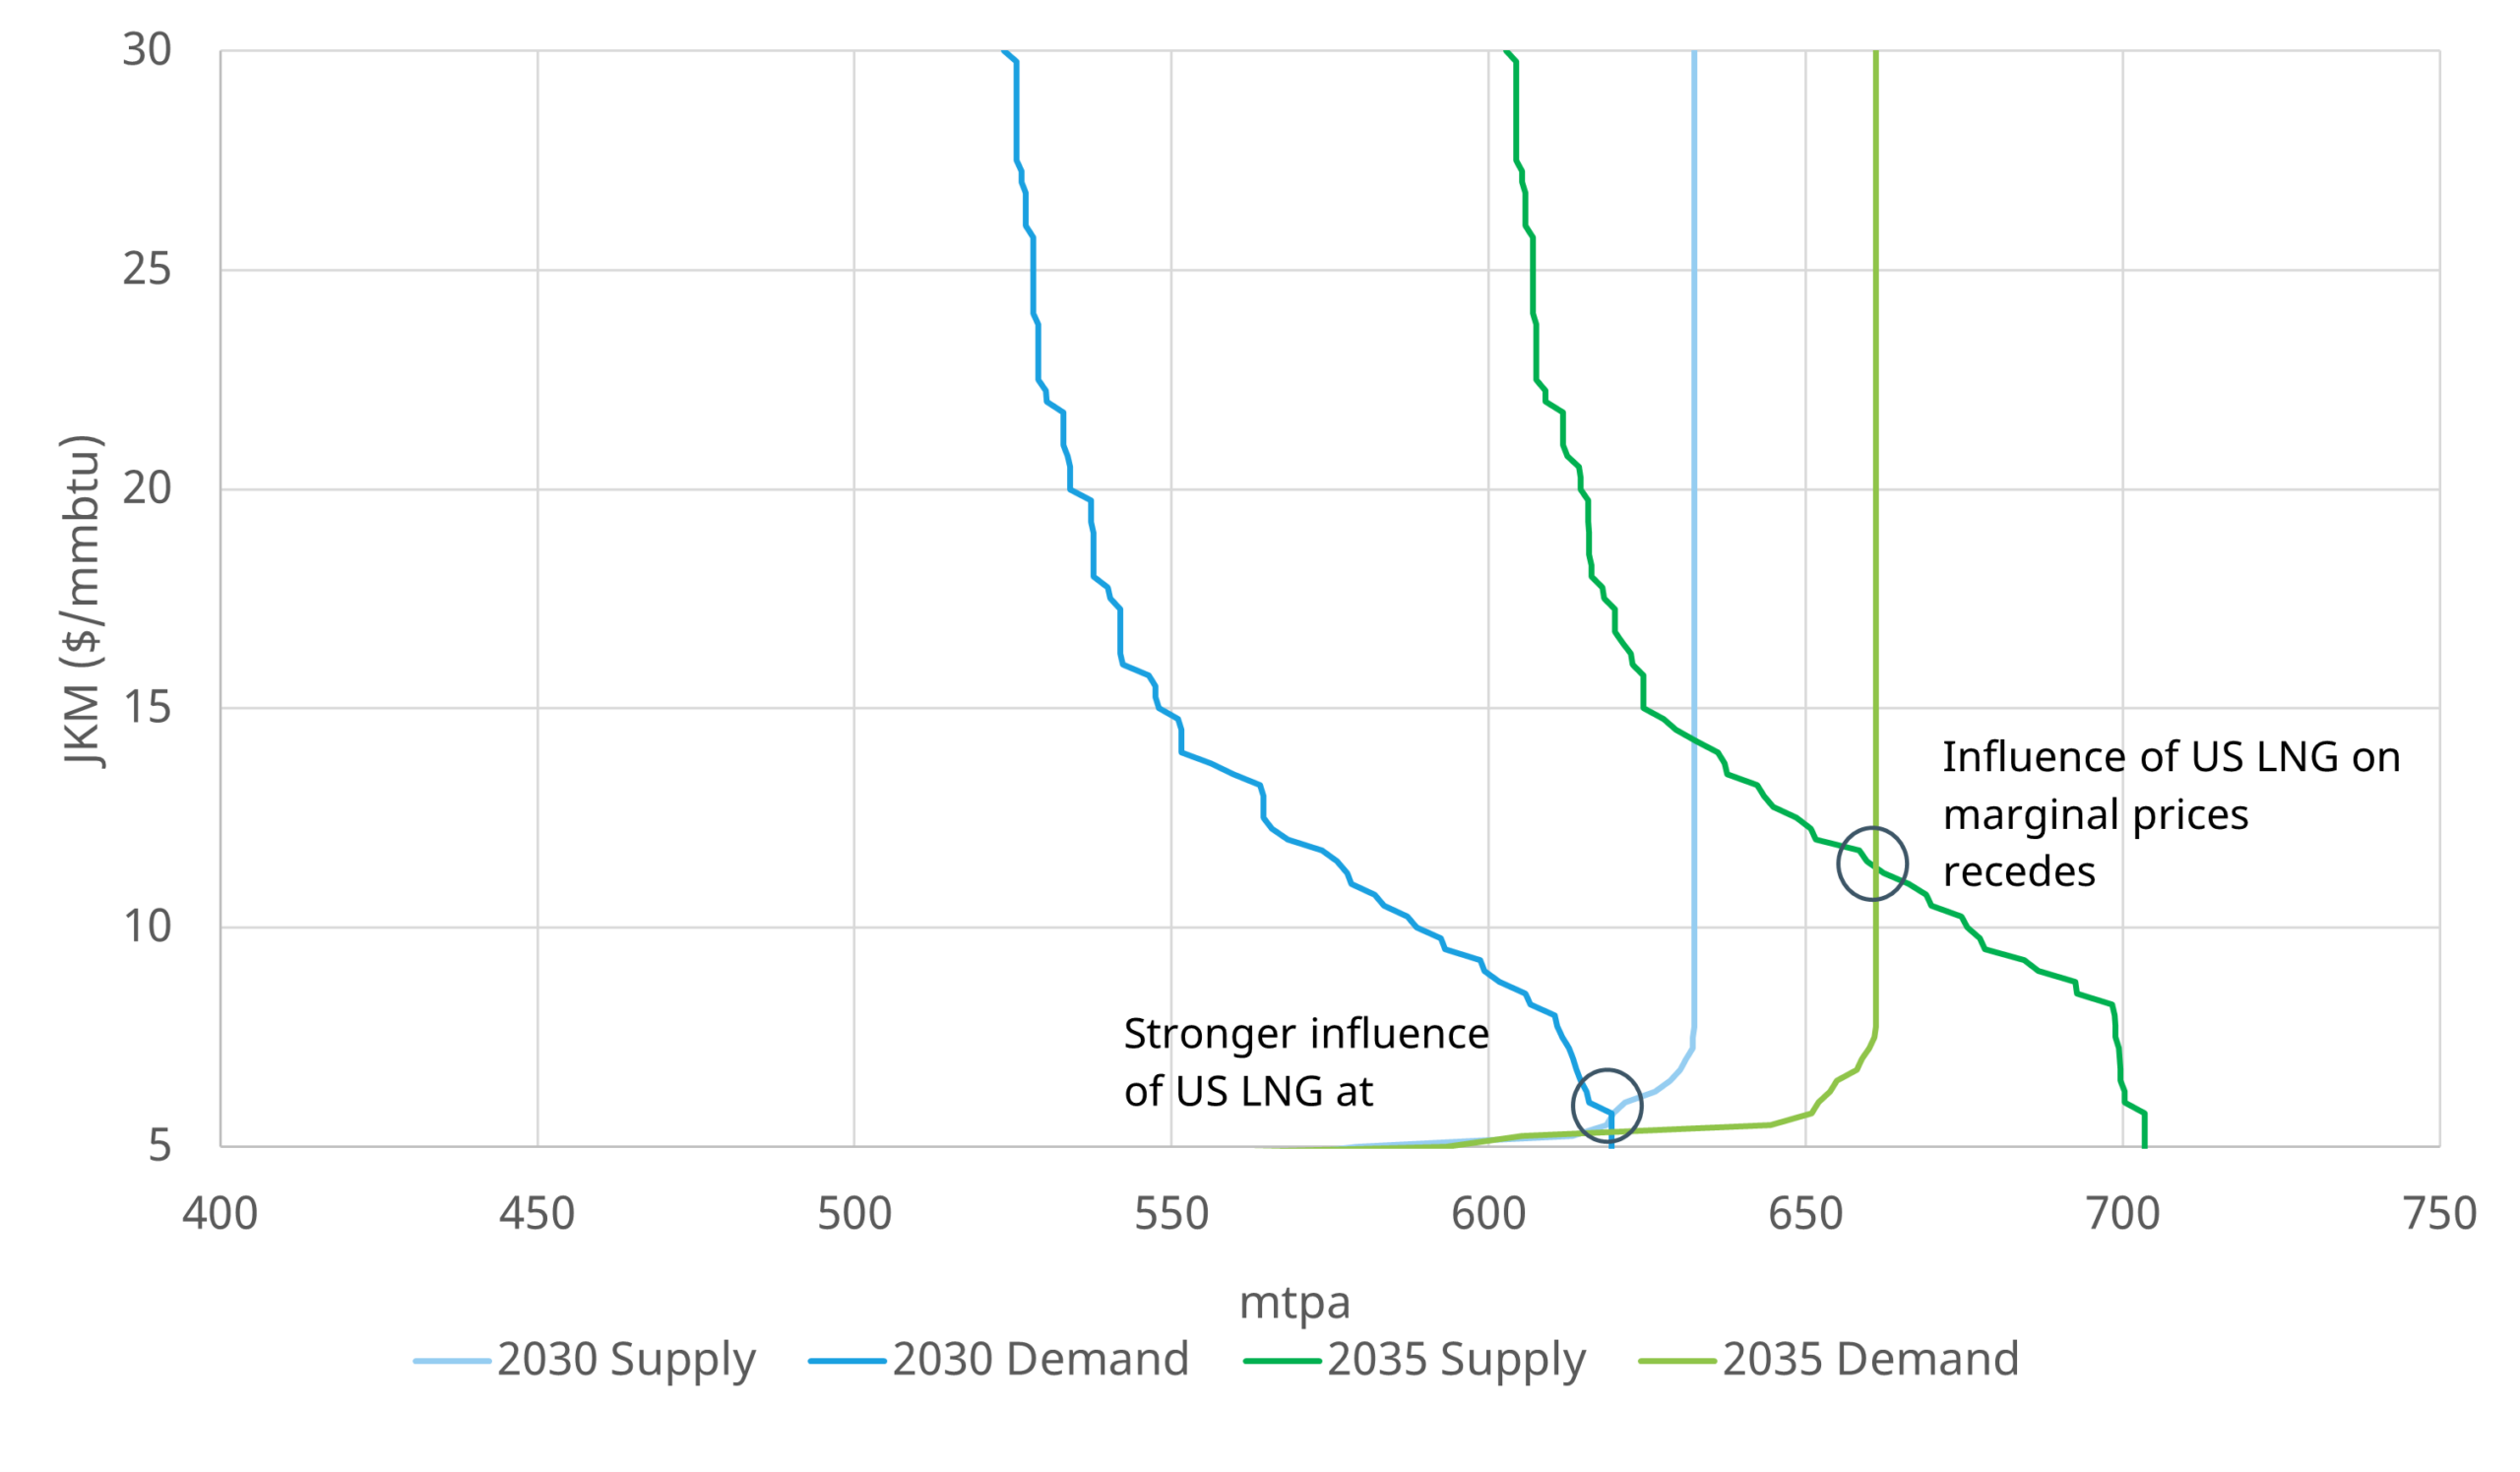
Source: Timera Global Gas Model
While the underlying intuition is relatively straightforward, robustly quantifying this dynamic is challenging without a modelling framework that explicitly captures market fundamentals and price formation.
5 key takeaways from the HH vs TTF correlation case study
1. Correlation is set to rise materially over the next 4–5 years. Our projection shows a significant step-up from current and historical levels as the LNG market balance shifts.
2. The driver is a fundamental regime shift. A substantial wave of new LNG supply – predominantly US Henry Hub-priced – is set to driver a looser market from the late 2020s into the early 2030s.
3. A well supplied market creates greater global price convergence and higher correlations. When HH-priced US exports are at or near the margin of global LNG pricing, TTF and Henry Hub are effectively linked through the same marginal clearing mechanism – pushing correlations higher.
4. Rebalancing reverses the dynamic. As the market tightens again and US LNG moves away from the margin, the structural basis for coupling weakens and we project correlation to revert back toward historical norms.
5. Quantification is where the real value lies – if you operate without the right tools you leave money on the table. Robust quantification is underpinned by projecting the evolution of volatility and correlation using stochastic fundamental market models – not historical metrics or simple forecasts.
For further information on our LNG & gas market modelling capabilities and related services, feel free to reach out to our LNG & Gas Director – David Duncan david.duncan@timera-energy.com.