Prompt gas price volatility is the key market price signal for short term supply flexibility response. Volatility plays a key role in determining the risk that gas suppliers face in supplying customer portfolios. Volatility also has a strong influence on the value of flexible supply assets. For example, it is an important driver of capacity sales revenue for the owners of storage, pipeline & interconnector assets.
Spot volatility at European hubs has remained subdued since the start of this decade. This has been due to weak gas demand and a prolonged surplus of supply flexibility at European gas hubs. But evidence is building in 2016 of what may be the start of a more structural recovery in European gas price volatility. Recent issues with the UK’s Rough storage asset, and uncertainty over it’s long term future, are playing an important role.
We provide fairly regular updates on historical volatility. Today we also look at an alternative measure of gas price fluctuations: implied volatility. This is a benchmark “implied” from the prices of traded gas options (see boxed section below) and is becoming an increasingly useful source of information on volatility as gas options liquidity at the UK NBP and Dutch TTF hubs improve.
Implied volatility on the rise
The attraction of implied volatility as a benchmark, is the immediacy of its responsiveness to changes in market conditions. It represents a current, forward looking, market view on the level of volatility. This is in contrast to historical volatility which is by definition backward looking. For further details on the characteristics of implied vs historical volatility see the box below and a previous article on the subject.
Historical vs implied volatility
Volatility can be estimated from historic price movements (‘historic volatility’). Volatility can also be estimated or implied from traded options prices (“implied volatility”). This is done by reverse-engineering the volatility consistent with the observed option price using a standard option pricing model. Implied volatility benchmarks have the advantage over historic volatility measures in that they are forward looking and include information on market expectations of future volatility (rather than what has happened historically). Implied volatility relies on access to prices or quotes for traded options. This means that implied volatility benchmarks are less accessible than historical volatility benchmarks (which can more easily be calculated from publicly available price information).
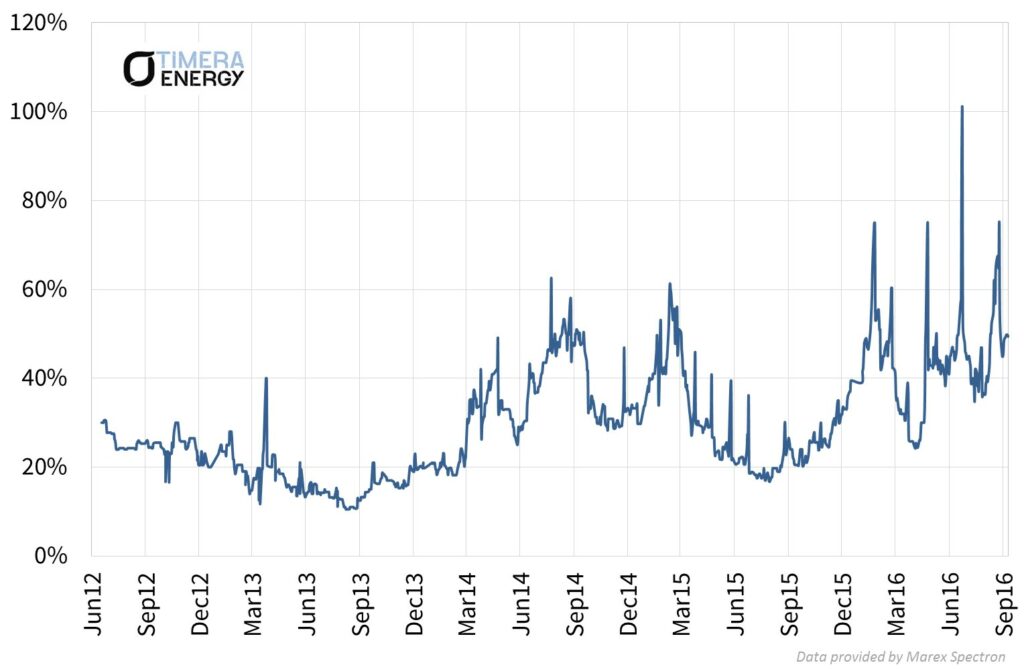
In layman’s terms, an increase in implied volatility can be interpreted as an increase in the market risk premium priced into traded options. This can be seen in practice in Chart 1 which shows a pronounced pickup in the implied volatility of NBP gas contracts across 2016. The volatility measure displayed on the chart comes from the front month NBP ‘at the money’ call option, based on Marex Spectron* data.
Chart 1: Implied volatility of UK NBP front month “at-the-money” call option

Source: Timera Energy (data from Marex Spectron)
The rise in NBP implied volatility at the start of the 2016 was driven by rapidly declining oil and gas hub prices. Volatility rose again in Q2 2016 as the result of a pronounced short squeeze. Since June, NBP volatility levels have been elevated by the outage issues at the UK’s Rough storage facility. Brexit has also helped by increasing the impact of GBP exchange rate volatility on NBP gas prices.
Rough storage plays an important role in dampening gas price fluctuations at the UK NBP. This is because gas is withdrawn from Rough in periods of higher prices and gas is injected in lower priced summer periods. The complete injection outage on Rough this summer has been a big factor driving higher NBP volatility, as prices have fallen more than they otherwise would have without Rough to absorb surplus gas. Looking ahead to the coming winter, reduced Rough withdrawal capability is likely to continue to support volatility via more pronounced periods of higher prices.
An interesting observation on Chart 1 is that the implied volatility benchmark is itself quite volatile. This reflects the limited liquidity in the gas options market in Europe. Price swings in relatively thinly traded options contracts can translate into big fluctuations in implied volatility. This is particularly the case when demand for options rises sharply relative to available liquidity e.g. the surprise Rough outage announcement this summer. However these sharp swings in implied volatility are typically short lived as liquidity returns and the market responds to arbitrage opportunities.
Historical volatility tells a consistent story
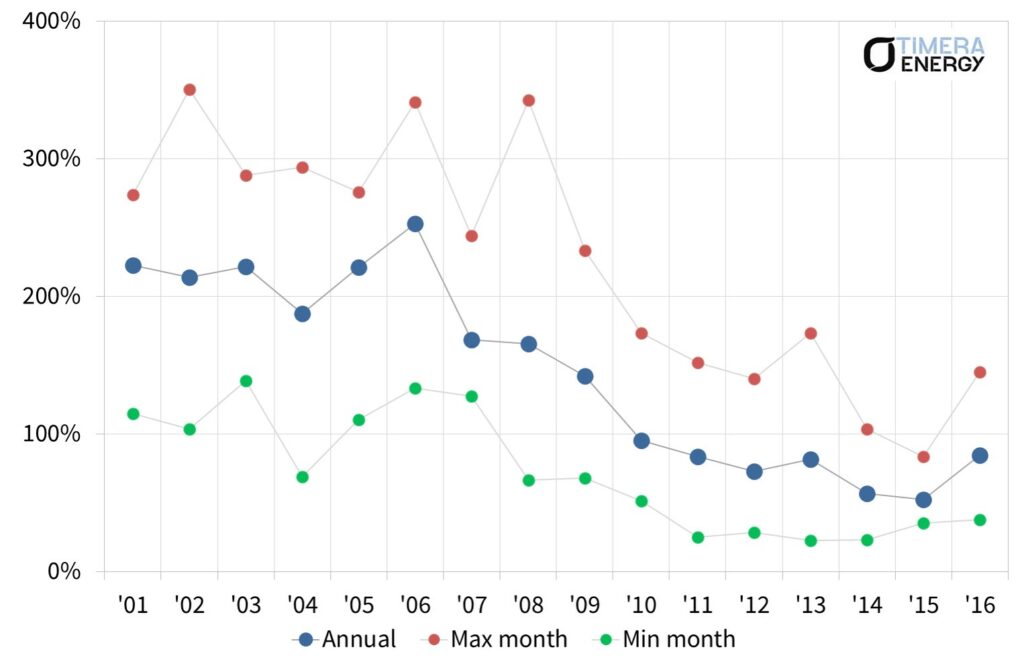
One key limitation of implied volatility as a benchmark is the relatively short available historical data set. It is only over the last three to four years that gas options liquidity has evolved to the point that supports sensible estimation of implied volatility. To understand the evolution of NBP price behaviour over a longer 15 year time horizon we return to historical volatility in Chart 2.
The recovery in historical volatility in 2016 (Chart 2) is not as pronounced as the one in implied volatility (Chart 1). But the perspective of a 15 year horizon also appears to suggest that 2016 may be marking the start of a volatility recovery.
Recovering volatility is consistent with several important fundamental drivers at work in the European gas market:
- Ageing & closing supply flexibility infrastructure (e.g. Rough and Groningen)
- A lack of investment in new flexible supply infrastructure this decade given weak market price signals
- Increasing swing demand from gas-fired power stations as load factors recover
- Increasing intermittency as development of wind and solar capacity continues
The fact that implied and historical volatility benchmarks are both pointing towards a recovery is an important sign that these fundamental drivers are starting to make an impact.
Article written by Olly Spinks & David Stokes
*For more information about the Marex Spectron implied volatility data please contact Richard Frape.


