European gas hub markets are maturing. This can be seen via the increase in range and liquidity of traded products. Growth in trading activity is focused on the UK NBP and Dutch TTF hubs, with TTF challenging the traditional dominance of NBP.
Consistent with maturing hub markets is a growing liquidity in traded gas options. There has also been growth in the penetration of shorter term flexible capacity products which contain embedded optionality (e.g. gas storage capacity). This means that gas price volatility is becoming a more transparent driver of value in energy portfolios.
In today’s article we look at two different volatility benchmarks (historical and implied). We also do a practical comparison of the evolution of these benchmarks over the last three years and consider their impact going forward.
| Historical vs implied volatility – the basics
If you are familiar with these measures of volatility feel free to jump ahead to the next section. Historical volatility Historical volatility involves a retrospective calculation based on observed market prices over a defined period in history. It is a statistical measurement of the realised price dispersions of a specified contract over a specified time period. For example: “Day-Ahead volatility in Apr 2015 was 55%”. Historical volatility is measured based on a dataset of realised historical price return observations. The wider the distribution of historical price returns, the higher the volatility measurement (and vice versa). Implied volatility The level of volatility expected by the market can be ‘implied’ from the prices of traded gas options. For example: “the Jan 2014 ICE NBP gas call option contract has an implied volatility of 50%”. The key to being able to imply volatility from traded asset prices is that the level of volatility is an input into the standard pricing formula (e.g. Black Scholes) used to value optionality. Option prices are a function of strike price, underlying gas price, time to expiry and volatility. So if the price of an option is known, then implied volatility can be backed out using the option pricing formula. |
Applications of historical vs implied volatility
The key advantages of historical volatility as a measure are its transparency and objectivity. There are minor variations in the way that historical volatility is calculated, but it represents a relatively simple and accessible statistical measure.
EnergyStock, the Dutch fast cycle storage operator, has recently started publishing a volatility dashboard which contains a set of historical volatility indices on TTF gas prices. The dashboard provides a new and useful source of data on rolling and annual indices for the TTF day-ahead and month-ahead contracts.
Publication of reliable volatility indices is an important step in developing market liquidity in products with embedded optionality. Gas traders need middle office sign off in order to do any transactions. And middle office in turn require an independent & objective volatility benchmark for P&L and risk measurement calculations (either as a simple input to benchmark the value / risk of vanilla option portfolios or as guidance for stochastic parameters required for more complex flex valuation models). Most speculative trading companies (e.g. hedge funds) do not permit traders to take exposures in a market until there is an established objective risk benchmark.
Robust implied volatility benchmarks have only recently emerged in the European gas market. The reason is that the meaningful measurement of implied volatility requires a critical mass of traded option liquidity. Implied volatility indices are well established in the oil market (e.g. the CBOE OVX index). But it is only over the last 3 to 4 years that gas options liquidity in Europe has supported the measurement of implied volatility.
The advantage of implied volatility over historical volatility is that is represents a current (forward looking) market view on the level of volatility. As such, reliable implied volatility data is highly valued by traders and risk managers.
Gas options price data is harder to come by than straight gas price data (used to calculate historical volatility). Marex Spectron, Europe’s leading gas options broker, has been developing a comprehensive dataset* covering volatility surfaces for key NWE hubs. ICE also publishes an implied volatility surface for the NBP and TTF hubs but the Spectron surfaces more accurately reflect the current market. This is because they include option bid / offer data where as the ICE implied volatilities are only based on the traded option prices on the exchange (some of which can be quite stale given sparse liquidity across some strike / maturity combinations). We have used this dataset in the next section to run a numerical comparison of historical vs implied volatility.
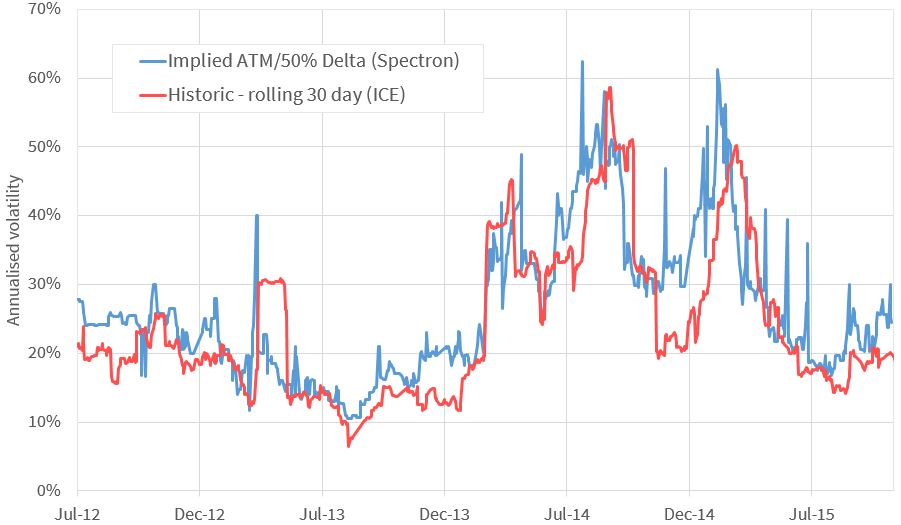
Running the numbers on NBP volatility
Chart 1 shows a comparison of:
- Historic 30 day rolling volatility on the ICE NBP Month-Ahead Futures contract
- Implied volatility from ‘at the money’ Month-Ahead NBP gas options