In our last gas market ‘state of play’ update we flagged a nascent recovery in global commodity prices from Mar 2024 supporting a gas price rally after a winter slump.
The commodity price rally has waned in Q3, given growing fears of a global economic slowdown. Benchmark European (TTF) and Asian (JKM) gas prices have however remained relatively strong.
The path from here will be influenced by whether the current economic slowdown is temporary or develops into a full-blown recession.
Demand concerns are growing across key commodity markets including oil, coal, copper & iron ore and the gas market is not immune, but this is only one of several important factors in play.
In this article we use 5 charts to explore key drivers of gas market evolution.
1. European gas demand remains weak
Post-crisis weakness in European gas demand has been a major factor behind the decline in prices since 2022.
Chart 1 shows the extent of the post crisis demand decline which has continued in 2024, with year on year gas demand down around 8% YTD in 2024.
Chart 1: EU-27 gas demand vs 2019-21 average

Source: IEA, ENTSOG (n.b. July and Aug are provisional data points)
Industrial gas demand has actually recovered slightly year on year. The largest driver of European demand weakness in 2024 is falling power sector demand reflecting:
- stronger French nuclear output
- relatively mild & windy weather
- relatively strong hydro levels
- soft power demand
- increasing RES output penetration.
The first three are either one-off impacts (French nuke recovery) or mean reverting (weather).
Against the weak commodity price & demand backdrop, European spot & forward gas prices have held up relatively well across Q2 & Q3.
2. Switching remains key driver of global gas price benchmarks
Chart 2 illustrates the importance of the coal for gas plant switching (CSP) range in anchoring TTF & JKM prices. The CSP range works dynamically with Asian LNG demand & switching response to drive TTF & JKM prices.
Chart 2: Global gas price benchmarks

Source: ICE, Timera Energy
The Q1 gas price slump we wrote about in our last ‘state of play’ article pushed TTF & JKM prices temporarily out of the bottom of the CSP range. However both spot & forward gas prices have rallied since February, with TTF prices pushing back into the middle of the CSP range across summer.
Chart 2 also shows the relative strength of TTF & JKM prices vs Brent across the last 3 months. Gas demand concerns have been offset by supply risks including Norwegian outages, LNG supply disruptions, the threat of further Russian flow cuts via Ukraine and ongoing geopolitical risk in the Middle East.
3. Asian LNG import strength, European declines
Aside from supply risks, the other factor supporting Q2-Q3 gas price strength has been a recovery in Asian LNG demand this year as shown in the left hand panel of Chart 3.
Chart 3: Asian & European LNG imports 2022-24
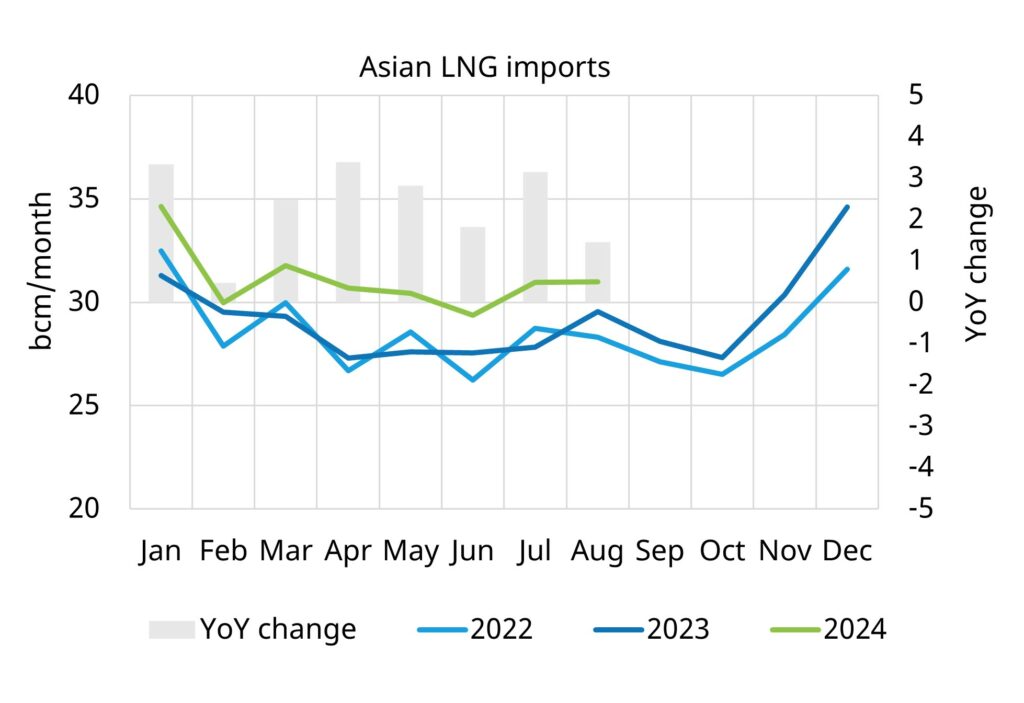
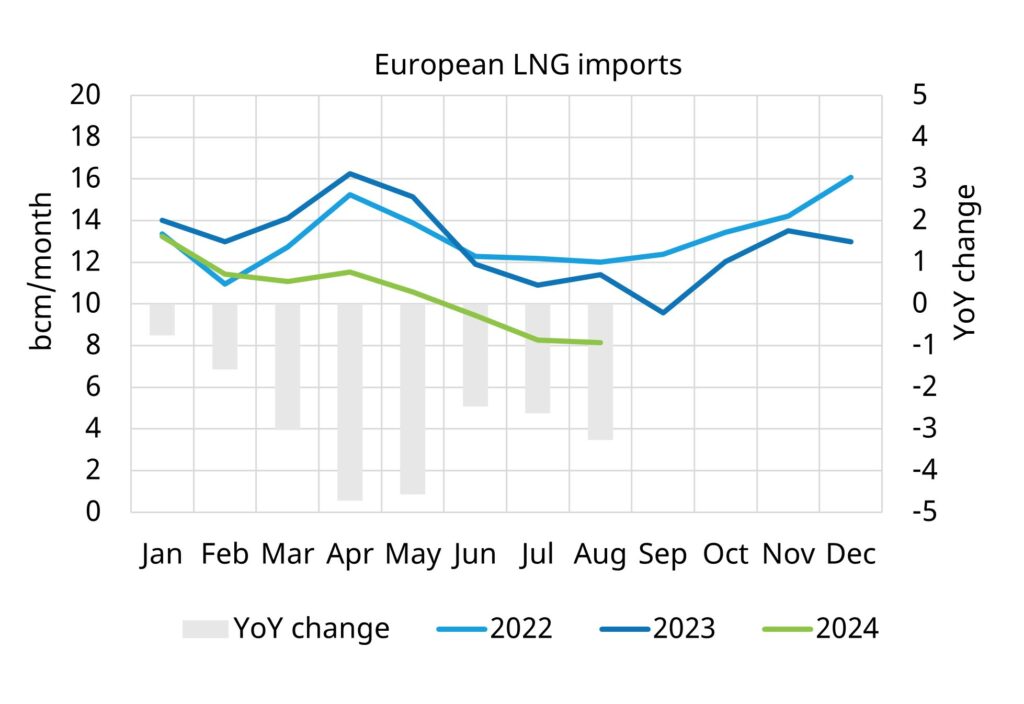
Source: Vortexa, Timera Energy
Asian LNG demand has recovered 8% year on year in 2024. This has been supported by relatively strong Chinese demand and price responsive flexibility from other Asian buyers as JKM prices have declined since the start of 2023. A hot July also saw particularly strong incremental air-conditioning driven demand from the Asian power sector.
At Timera we have continued to invest significantly this year in detailed modelling of Asian demand switching flexibility given the increasing importance of this in setting marginal gas prices (see link to article with more insights here).
The result of strengthening Asian LNG demand and a weak European gas demand backdrop has been a decline in European LNG imports, which have fallen 22% year on year in 2024 as shown in the right hand panel of Chart 3.
4. Winter buffer from high storage inventories
Risks across the approaching winter are dampened by near record storage inventory levels again in 2024 as shown in Chart 4.
Chart 4: European aggregate storage inventory levels

Source: Timera Energy, GIE
Inventories were high exiting last winter and storage injections have been strong across the summer. Europe is likely to enter winter with the ability to withdraw in excess of 95 bcm of gas from store.
Winter always comes with risks of cold weather driven demand events, supply outages & competition for LNG with Asia. However a storage buffer of this magnitude is a robust insurance policy against more extreme price shocks.
5. Forward curves have recovered significantly since Q1
In our final chart we show how shifts in supply & demand expectations are causing significant movements in gas forward curves. Chart 5 shows the scale of TTF curve moves across 3 periods:
- The start of last winter (Nov 2023), before weak demand saw a substantial winter price decline (the dashed green curve).
- The end of Feb 2024 from when prices started to recover (the dashed black curve).
- The forward curve from late last week (the blue curve).
Chart 5: Evolution of TTF forward curve across the last year

Source: ICE, Timera Energy
These are large forward curve swings relative to pre-crisis market conditions and they illustrate how we remain in a tighter market regime. The scale of these forward curve shifts reflect the inelastic (price unresponsive) nature of global supply & demand across 2024 and 2025, before new LNG supply comes online, as we set out in Chart 5 of our last ‘state of play’ update.
In our latest global gas subscription service report we have a strong focus on detailed analysis of how global supply & demand dynamics are driving prices across 2024-25 and how this is set to change with the onset of a new market regime from 2026. Feel free to contact us if you would like a sample copy of this report (see details below).
We are also going to be at Gastech in Houston (17-20 Sep) – feel free to contact David Duncan our LNG & Gas Director if you want to catch up (david.duncan@timera-energy.com).
Would you like more analysis?
We recently published our Q2 Global Gas Report, datasheet & chartbook. This forms part of our quarterly subscription service. Send us an email if you would like a free sample copy.
The report covers:
- Price recovery – dynamics driving gas price rise since Mar 2024 (e.g. Asian LNG demand rebound)
- Asian demand flex – increasingly important role of Asian flex in driving marginal prices
- Price evolution – our analysis of the evolution of JKM / TTF / HH price evolution to 2040 – inc. spreads, correlations, volatility dynamics
- Henry Hub – growing influence of US gas prices from 2026 (+ case study on impact of rising HH prices)
- Commercial impact – key takeaways on LNG & gas portfolio value impact.
For a free sample & more details feel free to contact David Duncan (LNG & Gas Director) david.duncan@timera-energy.com.