“Gas flows have flipped with major value implications”
Gas infrastructure flexibility within northwest Europe has been key to balancing the market since the energy crisis in 2022. The crisis has triggered a structural change in gas flow patterns.
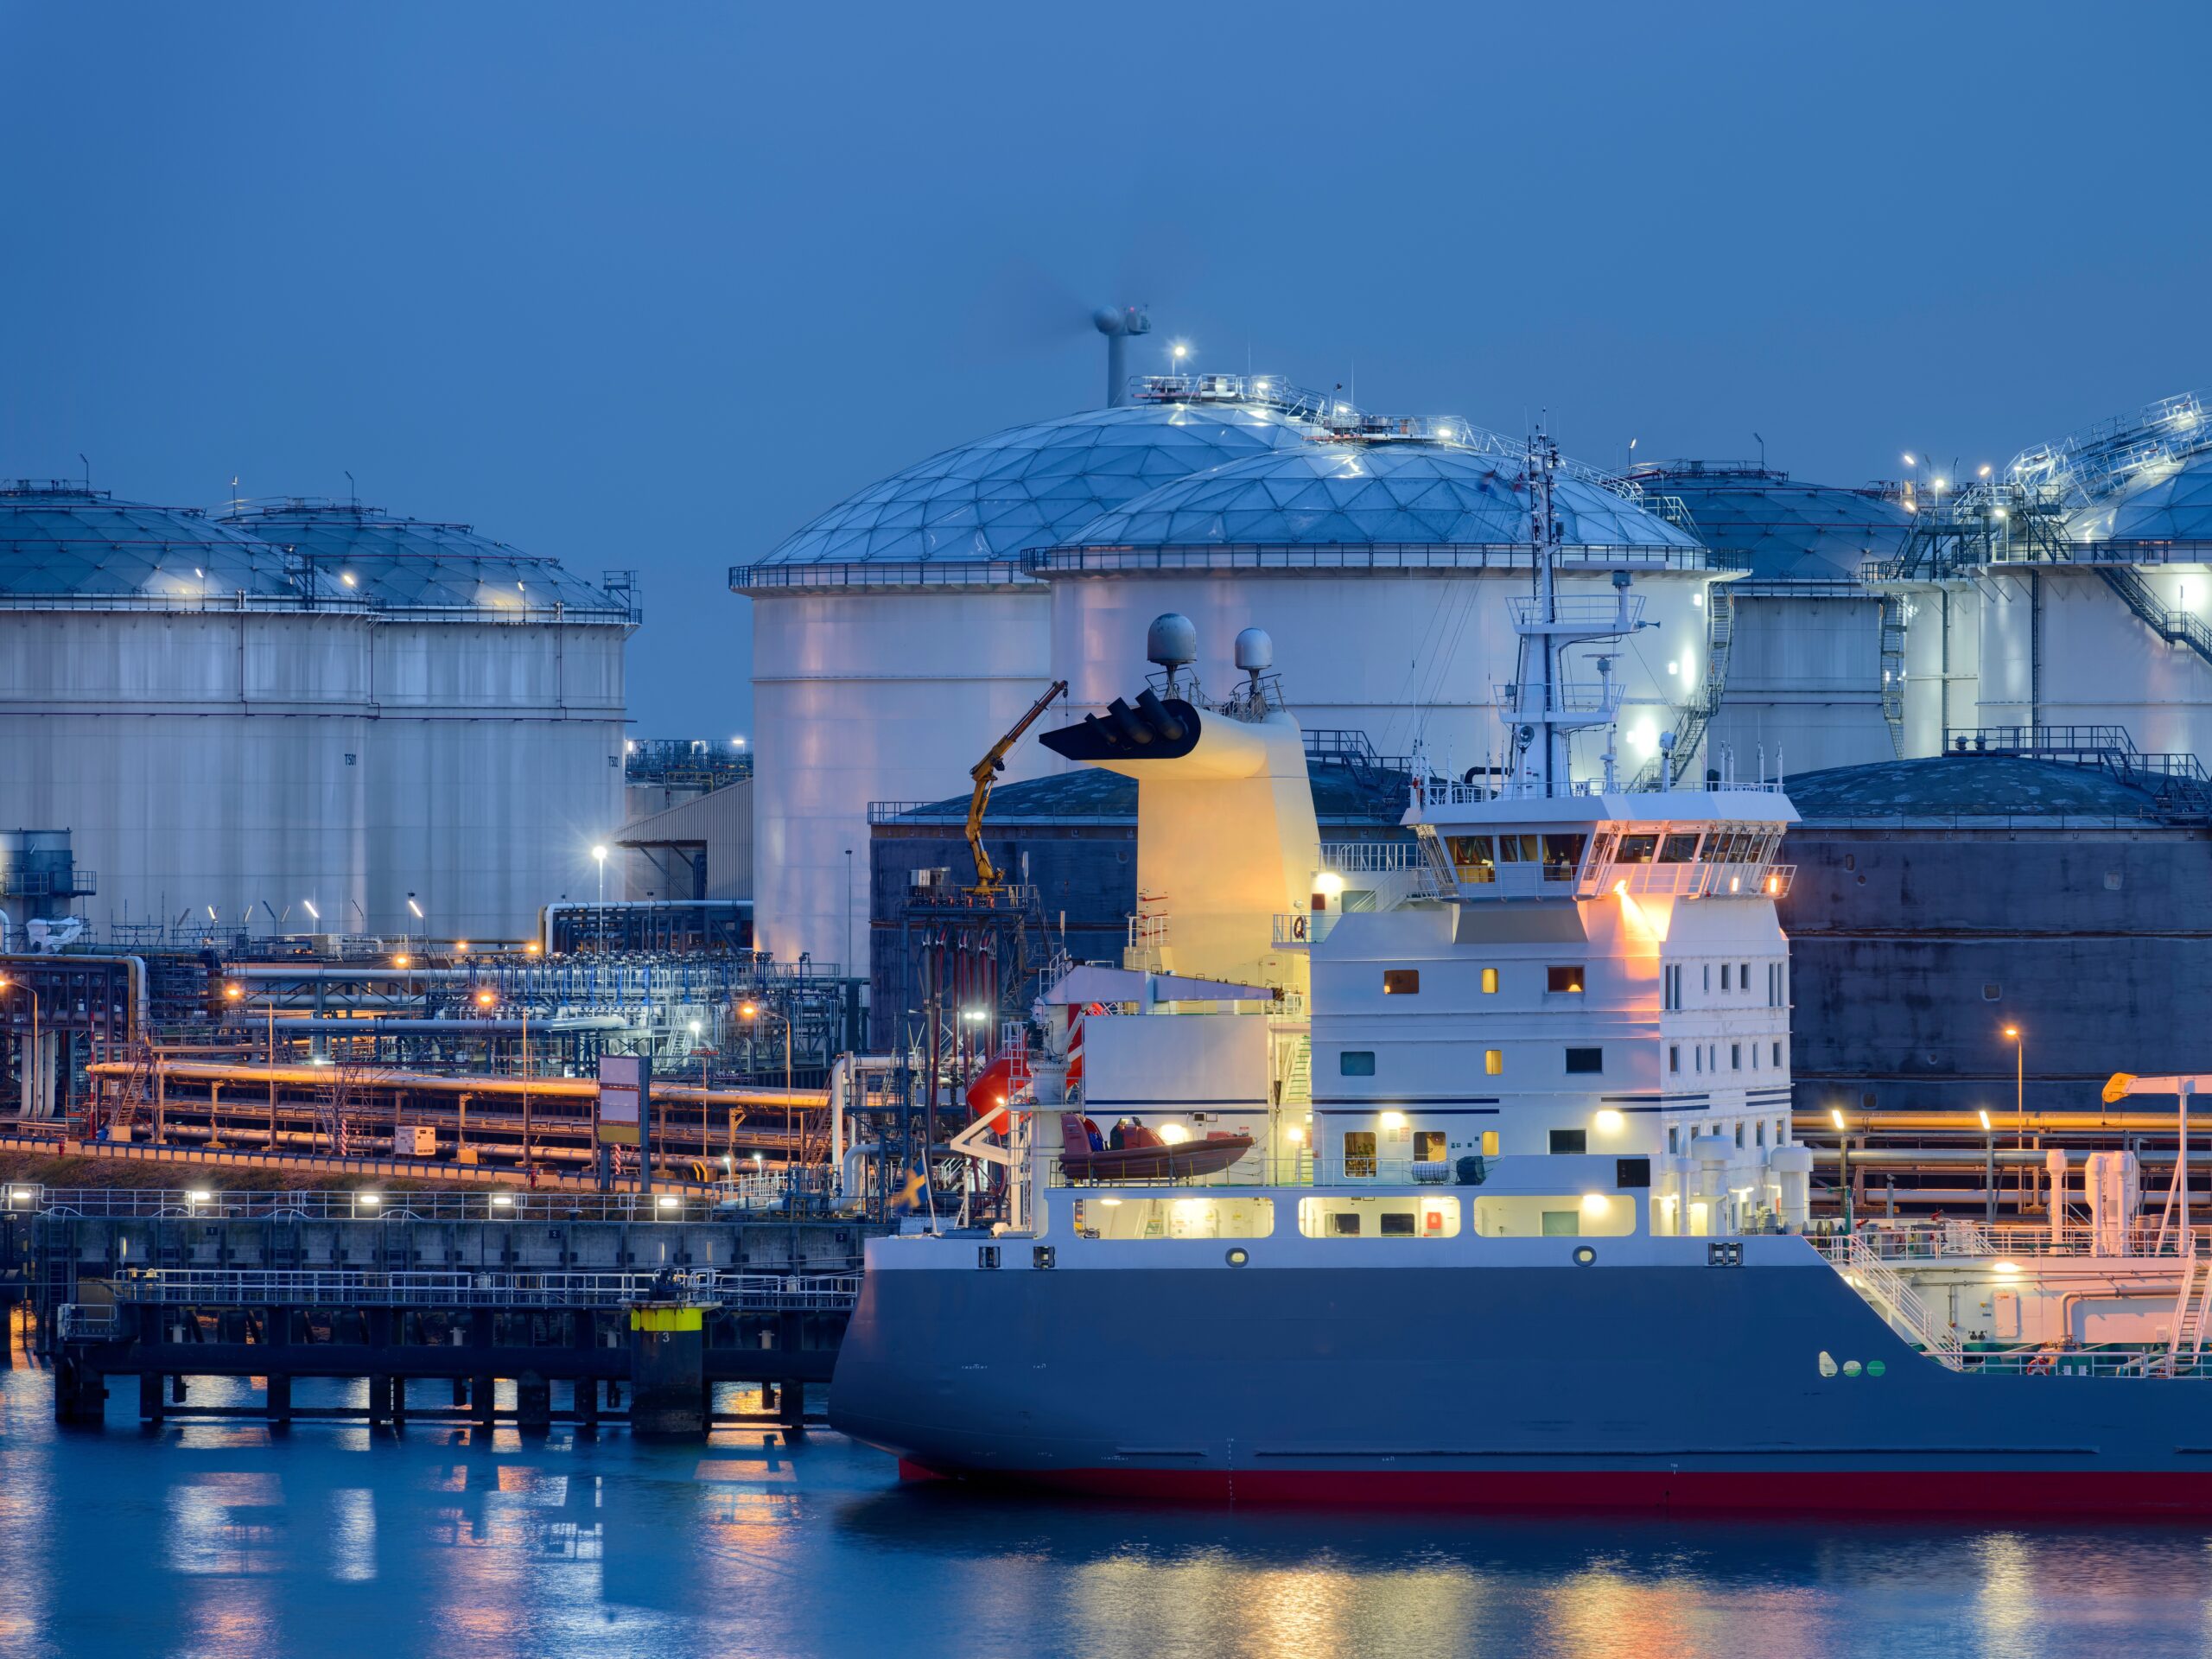
LNG supply replacing Russian imports means gas arrives in Europe from the west and flows east. This has fundamentally reshaped operation & value capture from flexible assets.
In today’s article we use a Netherlands case study to illustrate these changes, although many of the principles apply more broadly across Europe.
Netherlands market 101
We have chosen the Netherlands (NL) given it is home to TTF, Europe’s most liquid gas price hub. If you are not familiar with the NL gas market here is a quick overview in 3 summary bullets:
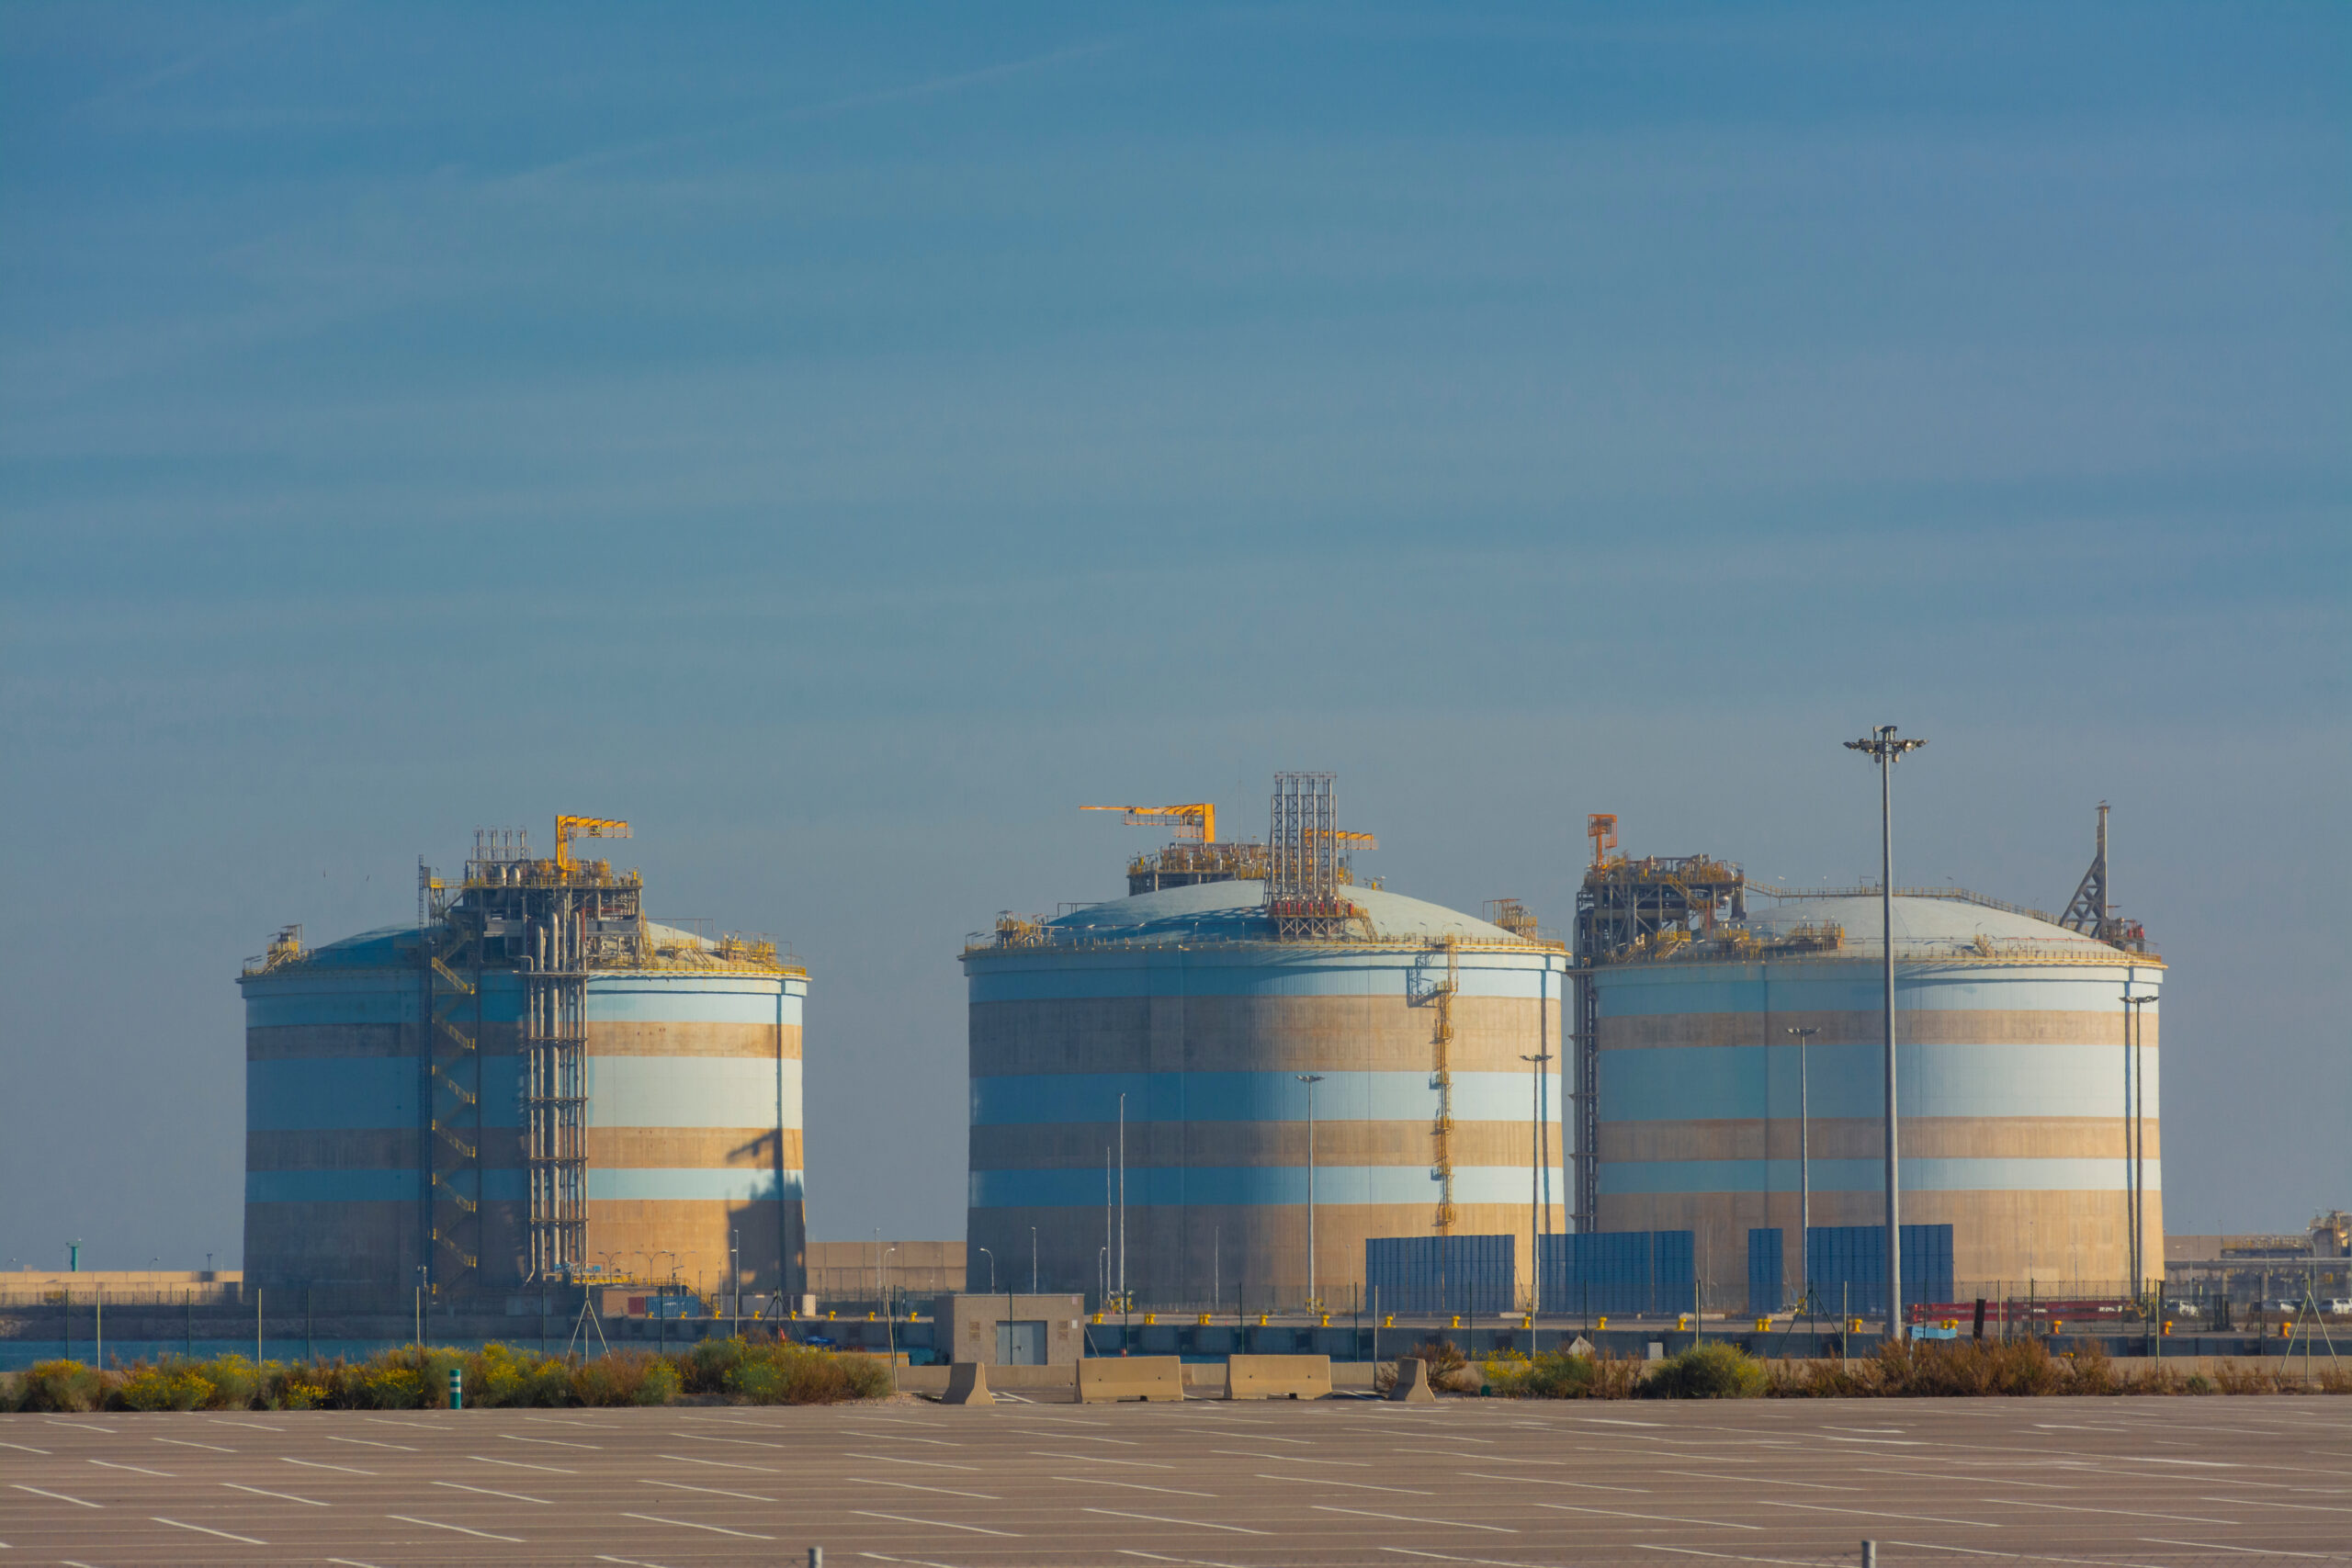
- Gas supply comes predominantly from domestic production (~10 bcm/yr), Norwegian production (~10 bcm/yr) & LNG imports (~20 bcm/yr). Demand is low in comparison to supply at near 30 bcm/yr, allowing for significant exports to Germany.
- Pipeline connections to Germany, GB, and Belgium provide ~32 bcm/yr of locational flexibility between NL and other hubs (THE, NBP and ZTP respectively).
- This is all tied together with ample amounts of storage capacity (~13 bcm) – which enables the NL market to be a provider of flex both domestically and for northwest Europe as a whole, particularly Germany.
Let’s now look at how the NL market has balanced across the last 4 years to illustrate the structural changes we flagged above.
Gas Year 2020: Covid crisis
Chart 1 shows the NL market Load Duration Curve for Gas Year 2020 (Oct 2020 – Sep 2021), a year characterised by a major Covid driven demand shock. Unless otherwise stated, all units are mcm/d.
Chart 1: GY 2020 Netherland LDC
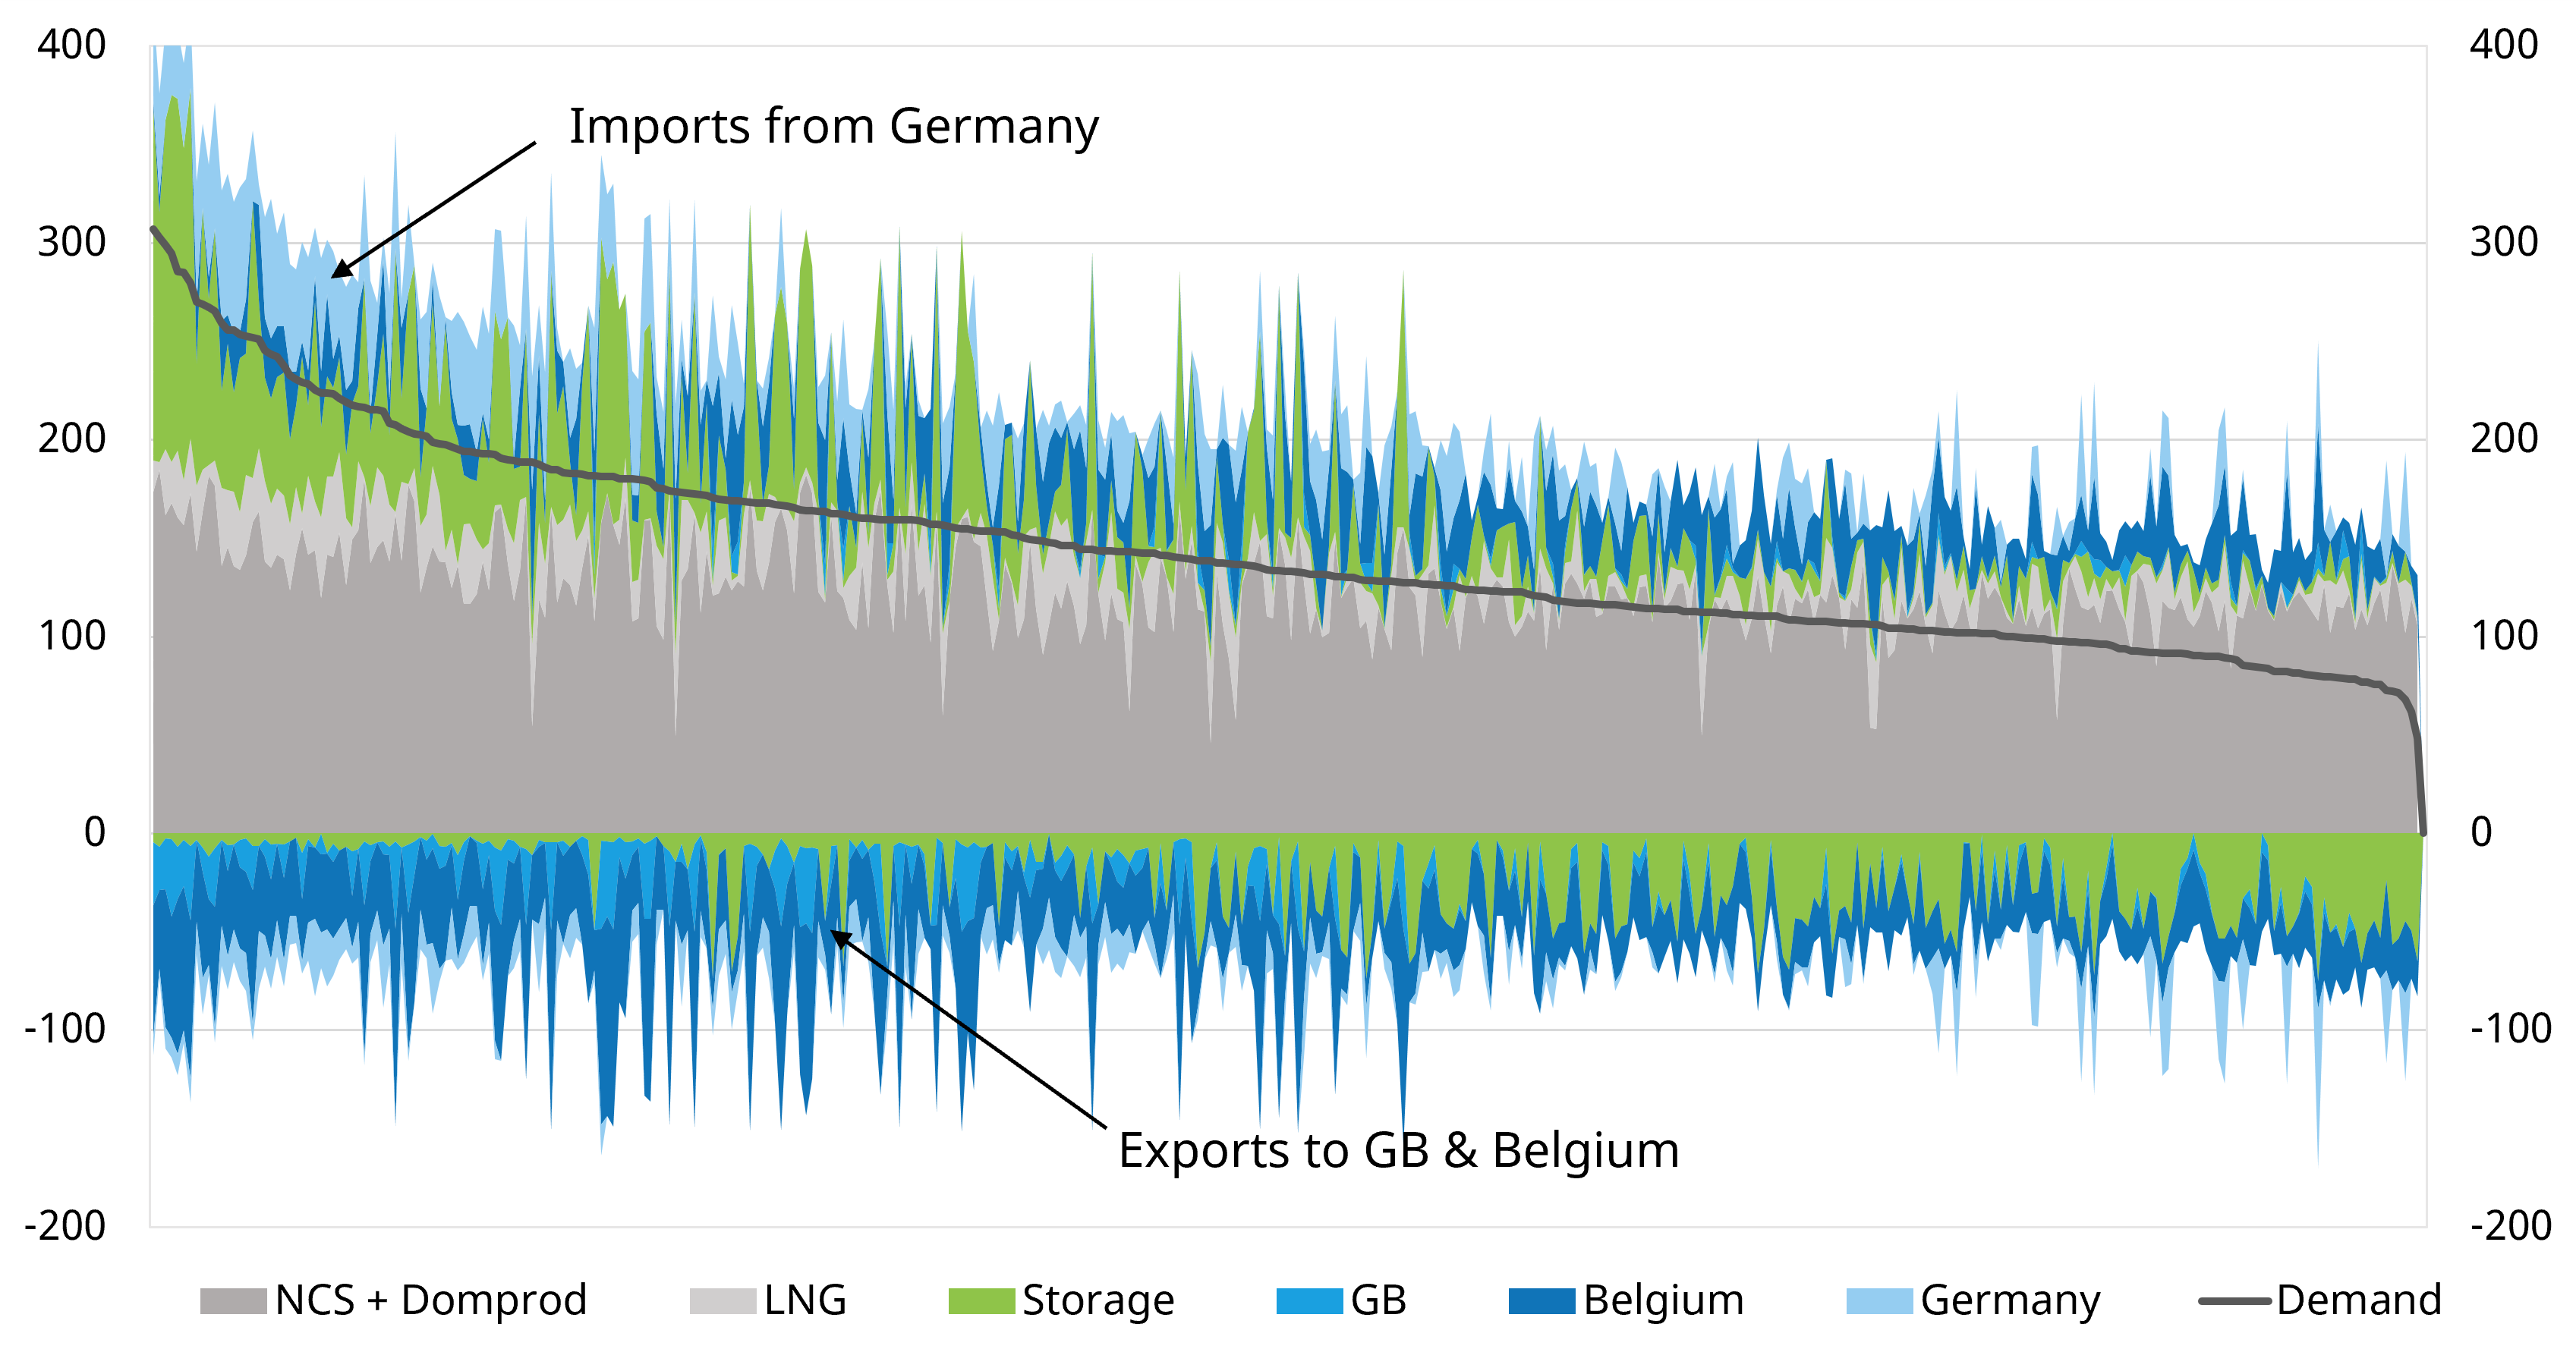
Source: Timera Energy, ENTSOG, Eurostat
Load duration curve charts illustrate how a market balances supply against demand. Demand days across the year are ordered from highest to lowest demand on the horizontal axis. Supply, interconnector, and storage flow volumes are then stacked against this demand line. The leftmost days on the chart show how high demand days balanced, while rightmost days show how low demand days balanced.
What can we see in Chart 1:
- Pre-crisis east-to-west transit of Russian supply is evident from consistent imports from Germany through to Belgium and GB.
- Domestic production and Norwegian supply provide strong baseload supply; the role of LNG imports remain limited although stronger on high demand days.
- Seasonal flexibility is provided by storage assets, which also enable NL to export to Belgium & GB via pipeline flex during colder periods.
Gas Year 2021 – crisis hits!
This was the year that Russia aggressively turned down the supply taps & up-ended the European gas market. Chart 2 tells the story.
Chart 2: GY 2021 Netherland LDC
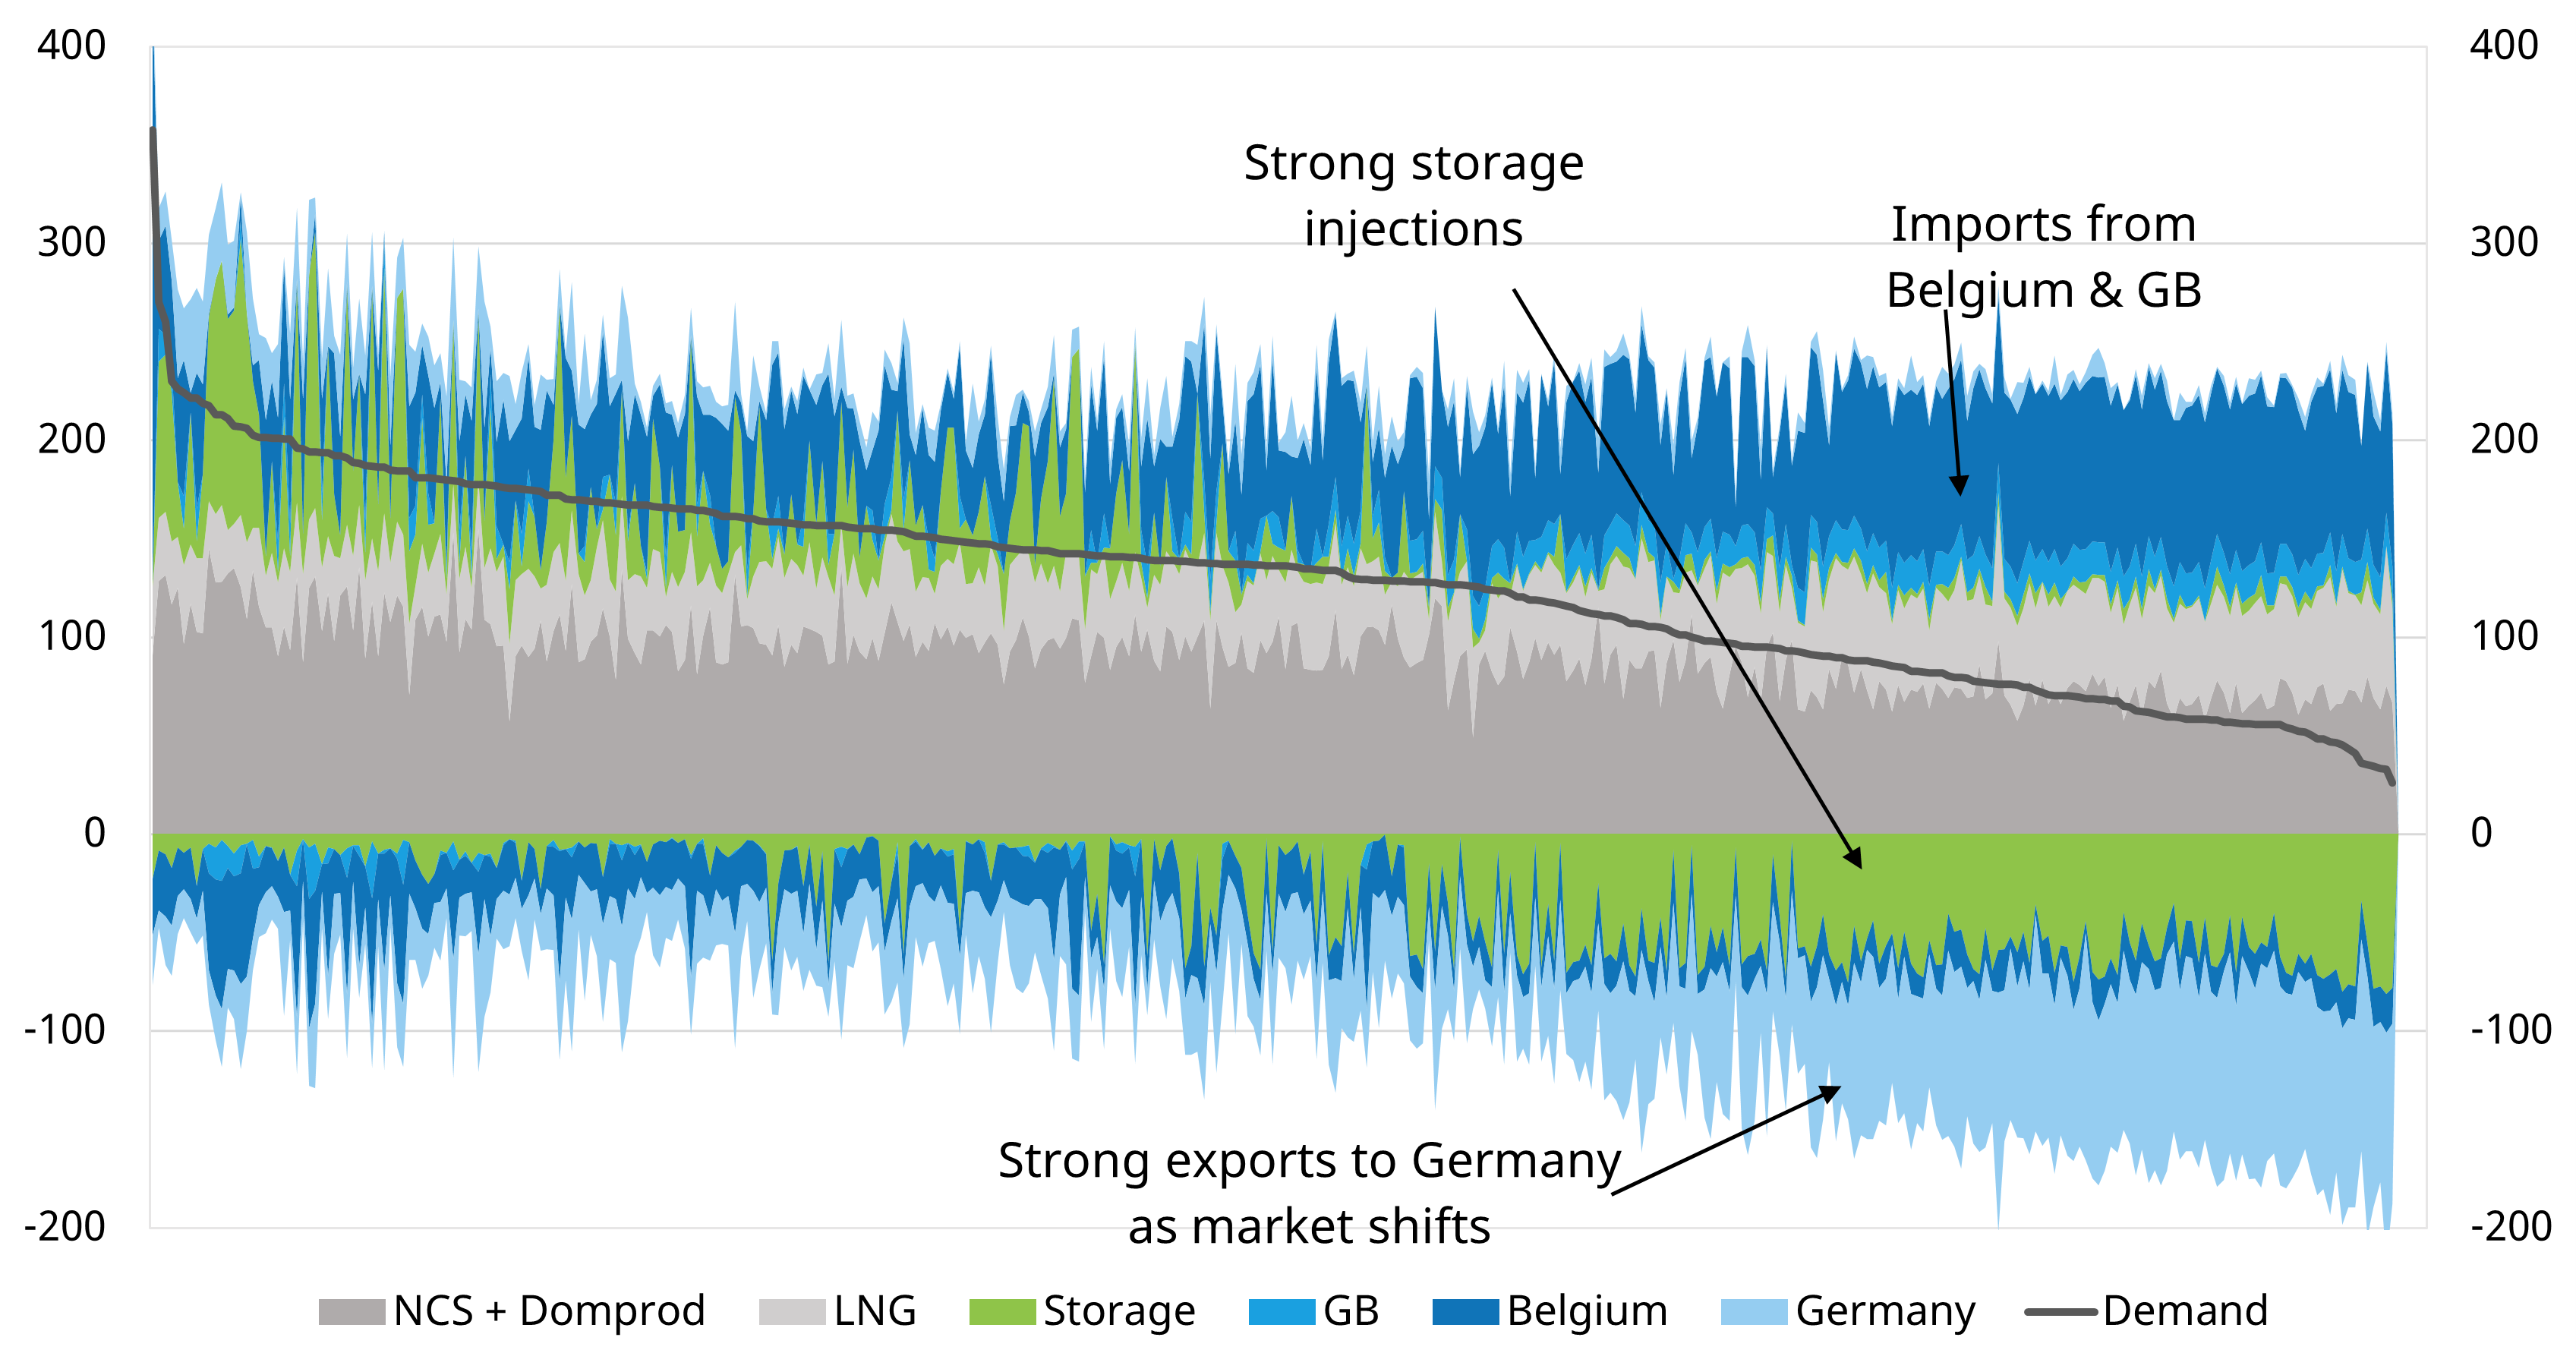
Source: Timera Energy, ENTSOG, Eurostat
- A major market shift is evident as Russian supply drops. NL still plays a transit role, but the direction of flow is reversed to move LNG imports from west to east.
- Imports from Germany halt, while NL begins high volume exports to DE instead, enabled by higher LNG imports.
- Pipeline assets flex to enable strong imports from Belgium, which serves to allow strong storage injections as EU storage mandate targets are introduced.
Gas Year 2022 – winter panic.. before tightness eases
This was Europe’s first full gas year without Russian gas. Panic in early winter subsided as gas market tightness started to subside given a mild winter & large LNG import volumes.
Chart 3: GY 2022 Netherland LDC
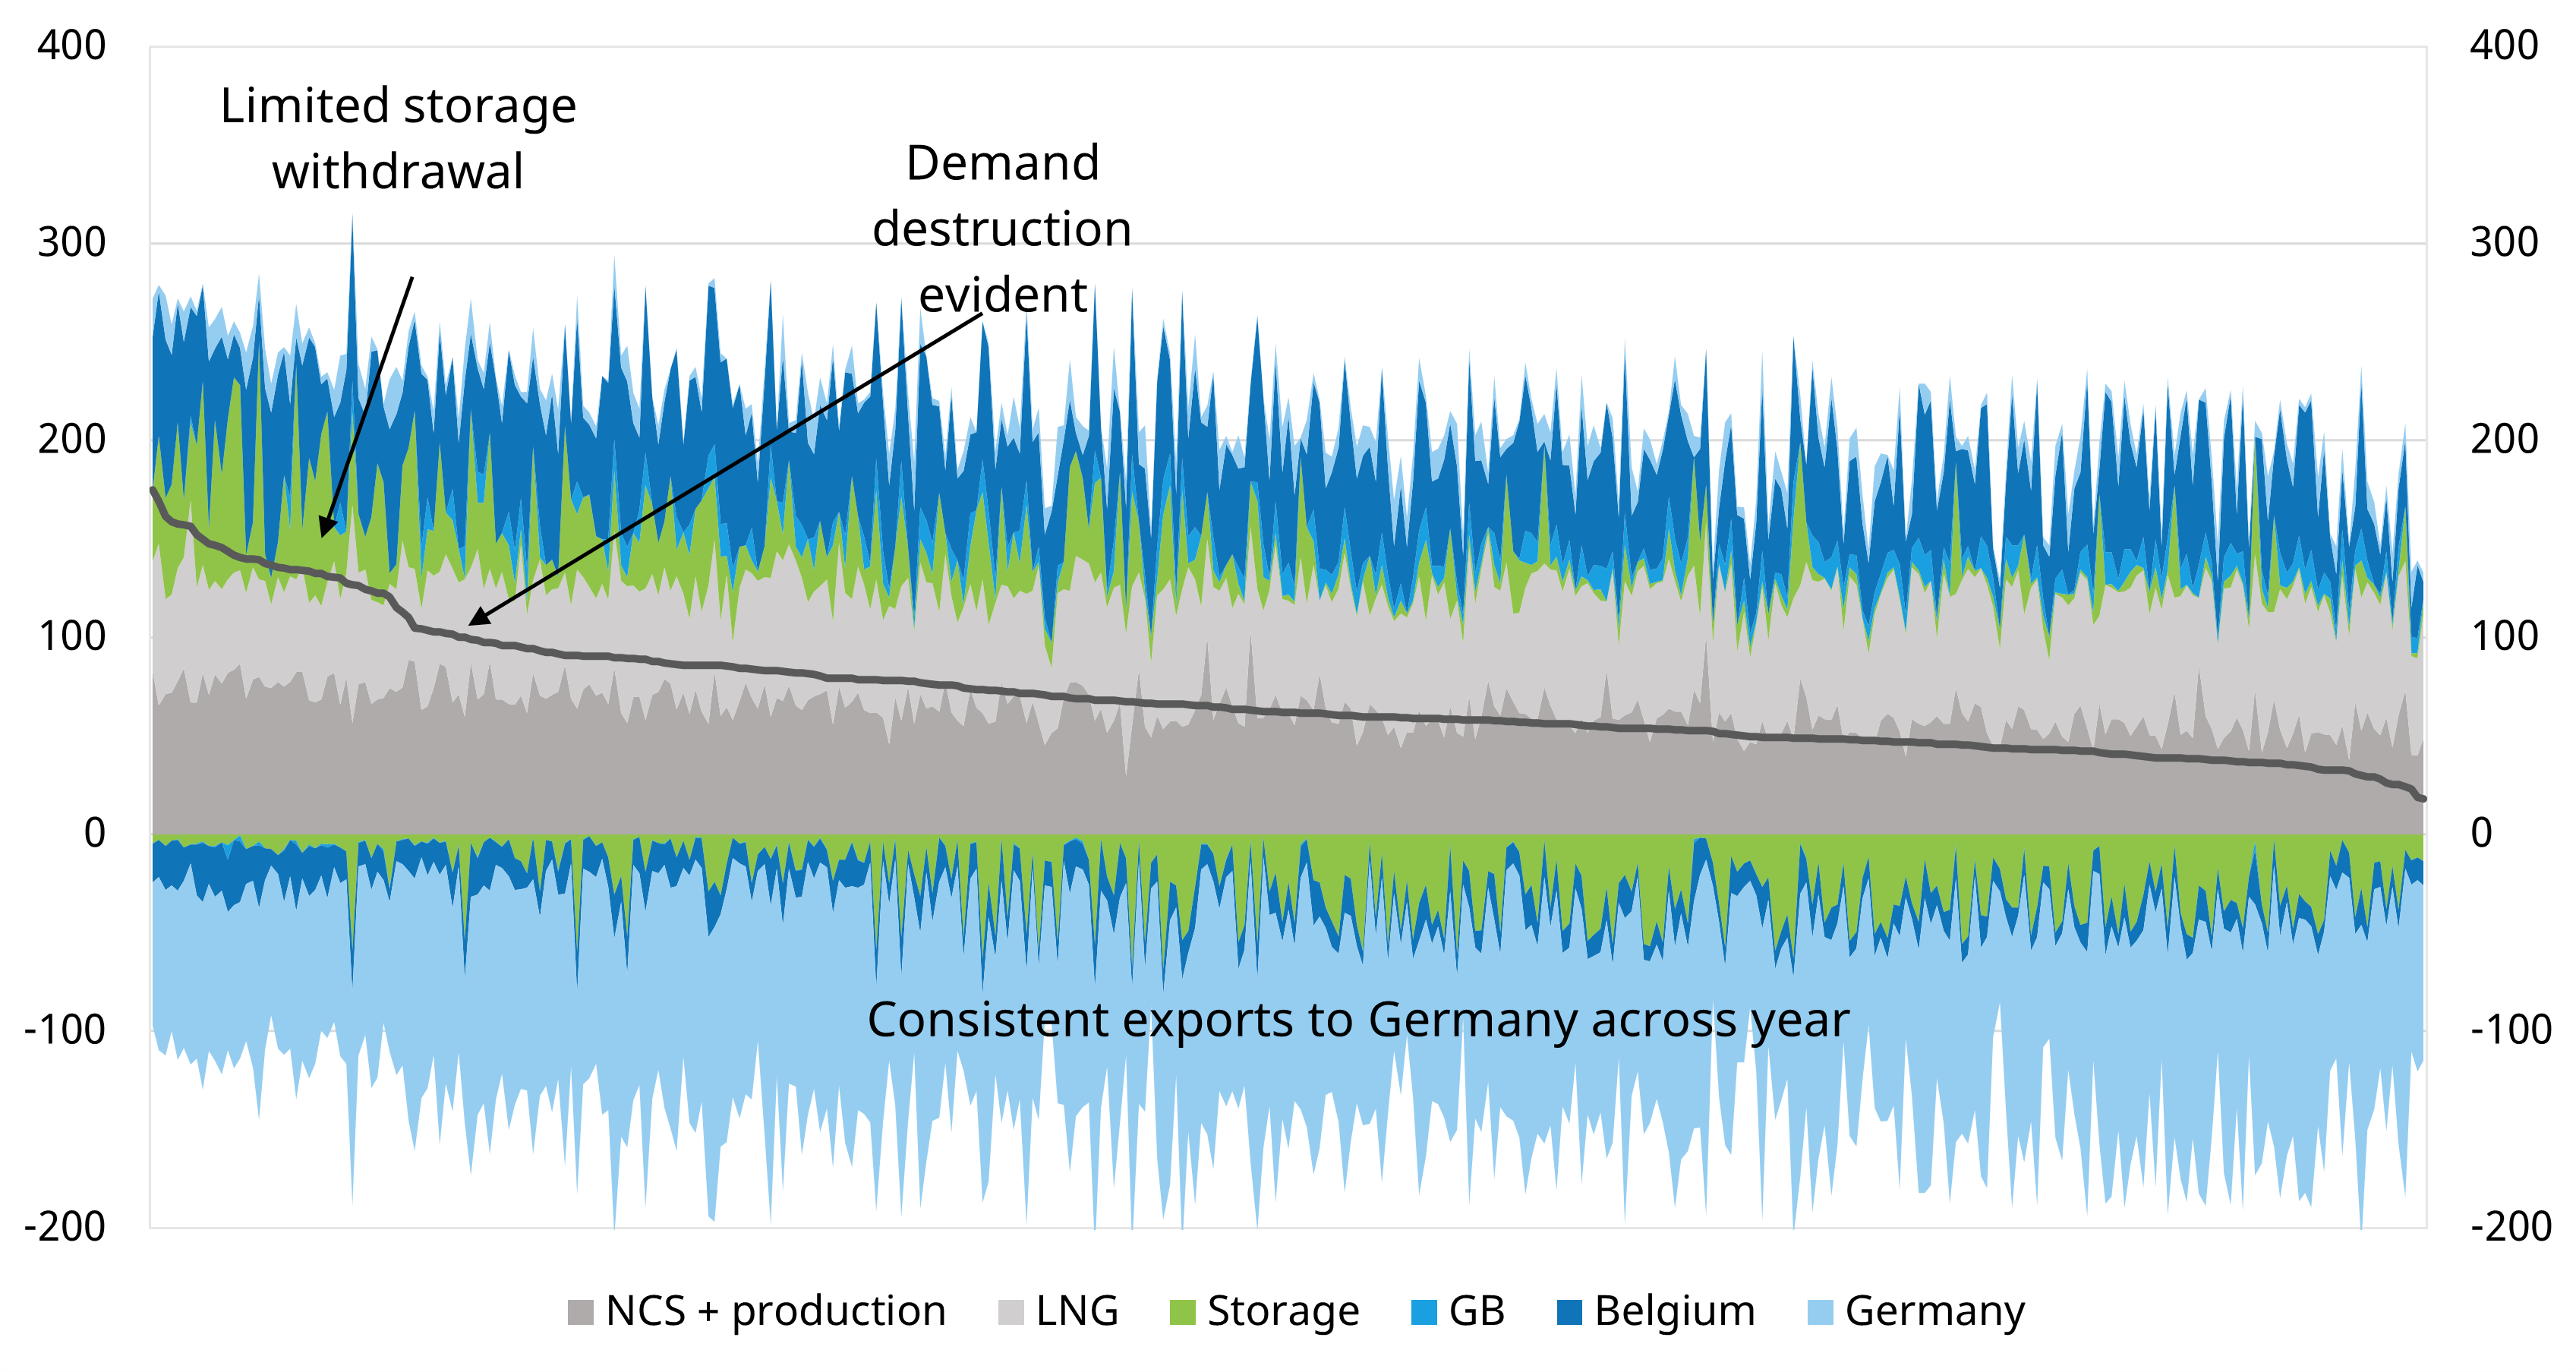
Source: Timera Energy, ENTSOG, Eurostat
- Demand destruction response in NL has been the strongest within northwest Europe, with significant demand declines between GY 2021 (42.4 bcm) and GY 2022 (33.1 bcm). This along with LNG imports via Gate LNG and new Eemshaven FSRU enables NL to remain a net exporter.
- NL is now a consistent exporter to DE, independent of domestic demand. This is despite declines in domestic production. Variation in pipeline flows illustrate short term flex capability.
- A mild winter limits storage withdrawals. Injection and withdrawals throughout medium demand years show how storage plays a part in providing shorter term flex.
Gas Year 2023 – demand & prices slump
The period from Oct 2023 – Sep 2024 reflects the new post-crisis gas market, with strong LNG import flows west to east and flexible supply infrastructure playing a key role balancing the market.
Chart 4: GY 2023 Netherland LDC
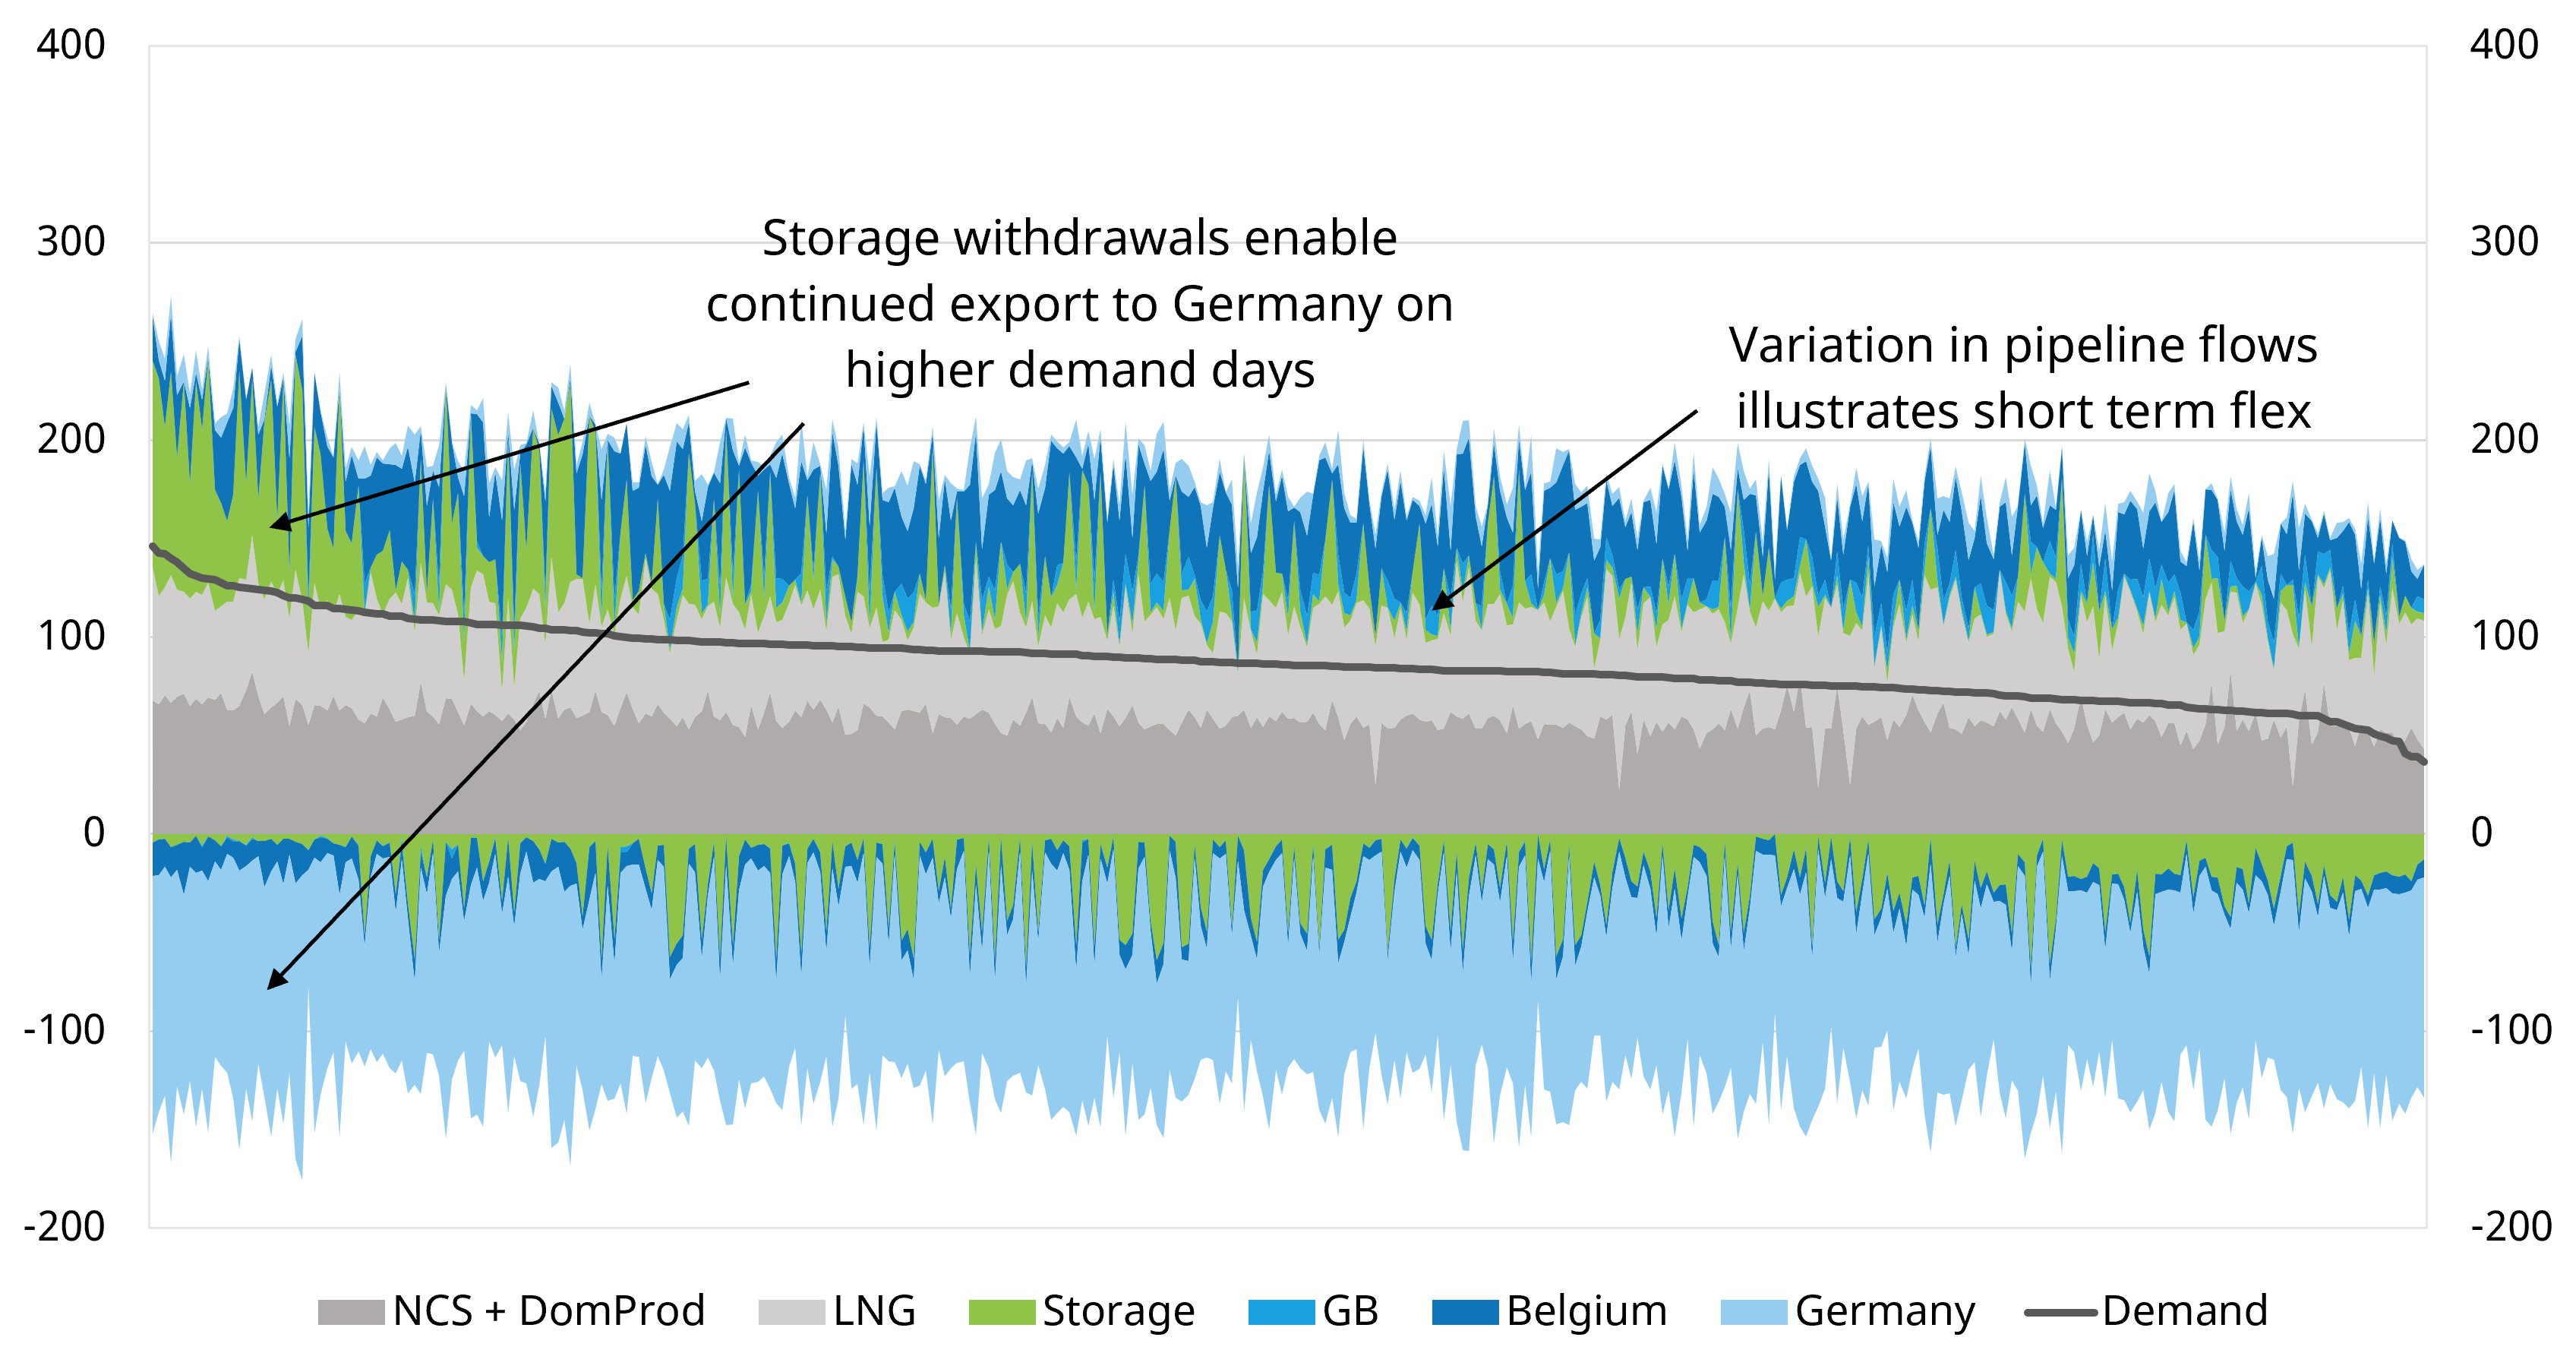
Source: Timera Energy, ENTSOG, Eurostat
- Strong storage withdrawals on high demand days serve the need for German exports rather than high domestic demand. Short term flex remains key to market balancing via both storage & pipelines.
- This emphasises the role of NL storage as a key element of the NWE balance – providing flexibility not just domestically, but also to its neighbours.
- EU storage mandates are enforced more strongly in Germany for example, which means that Germany sends price signals to incentivise supply from NL vs withdrawing from its own storage stocks during periods of high demand (dynamics seen again in the recent Dunkelflaute episodes).
5 key takeaways
Let’s finish with 5 key takeaways from the market evolution we set out above:
- Flow patterns and the use of supply flexibility has structurally changed over the last 3-4 years as a result of LNG replacing Russian imports
- Flexible infrastructure assets such as pipeline and storage play an integral role interacting to balance northwest European markets
- Flexible asset revenue and extrinsic value capture has been significantly impacted by shifting market fundamentals
- Individual country policy & regulatory dynamics can have big implications for gas flows and flex requirements (e.g. implementation of storage mandates, transportation charging), domestically & for neighbouring countries.
- The shifting dynamics we set out above are triggering gas asset infrastructure owners & capacity holders to (i) update asset valuations (ii) challenge & refine commercial management strategies.
If you are interested in a sample copy of our Q4 Global Gas Report & Databook, which goes into detail on the state of the market & our future outlook, or further information on the bespoke services we offer, feel free to contact David Duncan (Director, Gas & LNG) david.duncan@timera-energy.com