“Supply shocks are the ultimate test of
The Iranian conflict has triggered a major global gas supply shock. Recent strikes on Qatar’s Ras Laffan have removed approximately 13 mtpa of LNG capacity from the market for an estimated three to five years.
The conflict remains fluid and there is a material risk of further supply loss, although this is set against a backdrop of more than 200 mtpa of new supply coming online by 2030. Rapid shifts in supply expectations are driving extreme price volatility and thin market liquidity.
In this environment, the ability to dynamically quantify, originate and manage value within LNG portfolios is not just useful – it is what separates companies that respond effectively to a shock from those that are simply exposed to it.
In this article we summarise the challenge facing the four core functions within an LNG trading business, and illustrate why a consistent, dynamic view of value distributions underpins the ability to act.
Four functions, one consistent view of value
LNG portfolio management spans a range of time horizons, each managed by different teams with distinct commercial objectives. As set out in Diagram 1, we group this into four core functions:
1. Portfolio construction (5 yrs+) — long-term structural exposure management
2. Value management (1–5 yrs) — trading & origination horizon
3. Prompt optimisation (<1 yr) — physical and logistics management (ADP)
4. Risk management — underpinning all three commercial functions
Diagram 1: Core functions behind LNG portfolio value management
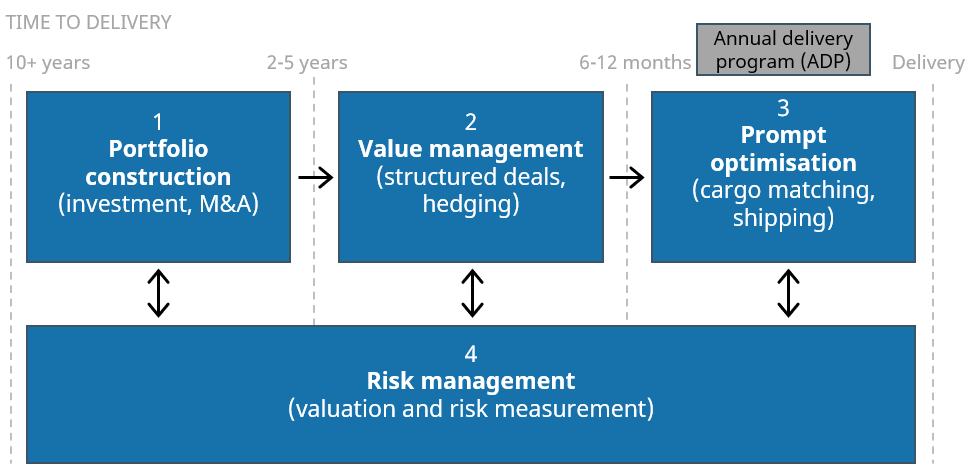
Source: Timera Energy
Responding effectively to a shock requires all four functions to move in concert – and that is only possible if they are working from a consistent view of asset & portfolio value.
This enables robust quantification of the impact of market moves that can be applied coherently & dynamically across all functions. In the case study below we focus on the value management horizon (1–5 years) to illustrate what this looks like in practice.
Case study: valuation of a US tolling deal in 4 charts
Our case study is focused on origination of a US LNG export tolling deal running from 2027 to 2030 (115% HH variable fee, fixed tolling fee, one cargo per month).
The market is currently digesting two interacting structural forces: (i) the Middle East supply disruption — at minimum removing ~13 mtpa of Qatari supply for three to five years and (ii) more than 200 mtpa of new supply coming online by 2030.
Rapid shifts in market expectations of how these two forces interact is a key driver of current price volatility. This has significant consequences for both intrinsic and extrinsic contract value.
Our case study contract straddles both structural forces, giving a clear illustration of how value management priorities shift as the market rebalances from the current shock.
Chart 1 shows the annual margin distribution for the tolling deal (2027–30), measured against current forward prices.
Chart 1: Annual intrinsic & extrinsic margin of US toll + P5–95 distribution envelope
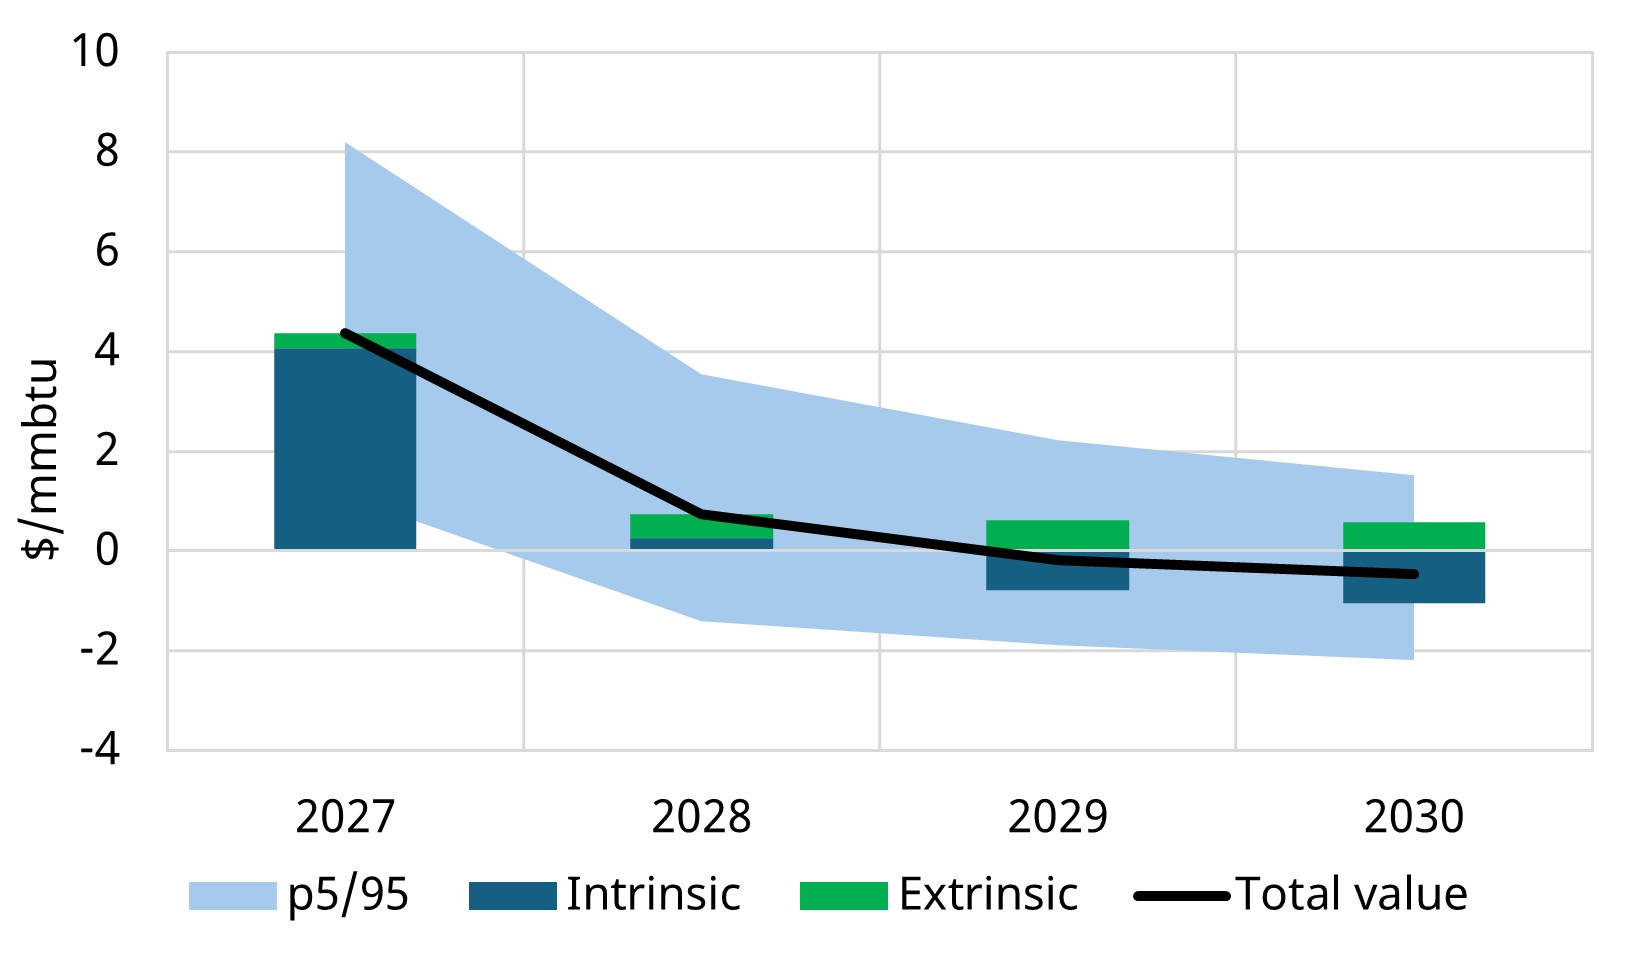
Source: LNG Bridge portfolio valuation model
The supply shock is opening up material intrinsic value in 2027 as TTF and JKM surge above Henry Hub. By 2028, however, the weight of incoming new supply rapidly erodes contract margins – shifting focus from intrinsic value to the extrinsic value of contract flexibility.
Chart 2 quantifies the value impact of contract flexibility. The S-curves show the full tolling contract margin distribution (P0 to P100) with and without flexibility terms (focused on cancellation and diversion flexibility options).
Chart 2: Risk profile and incremental value of US tolling deal flexibility terms
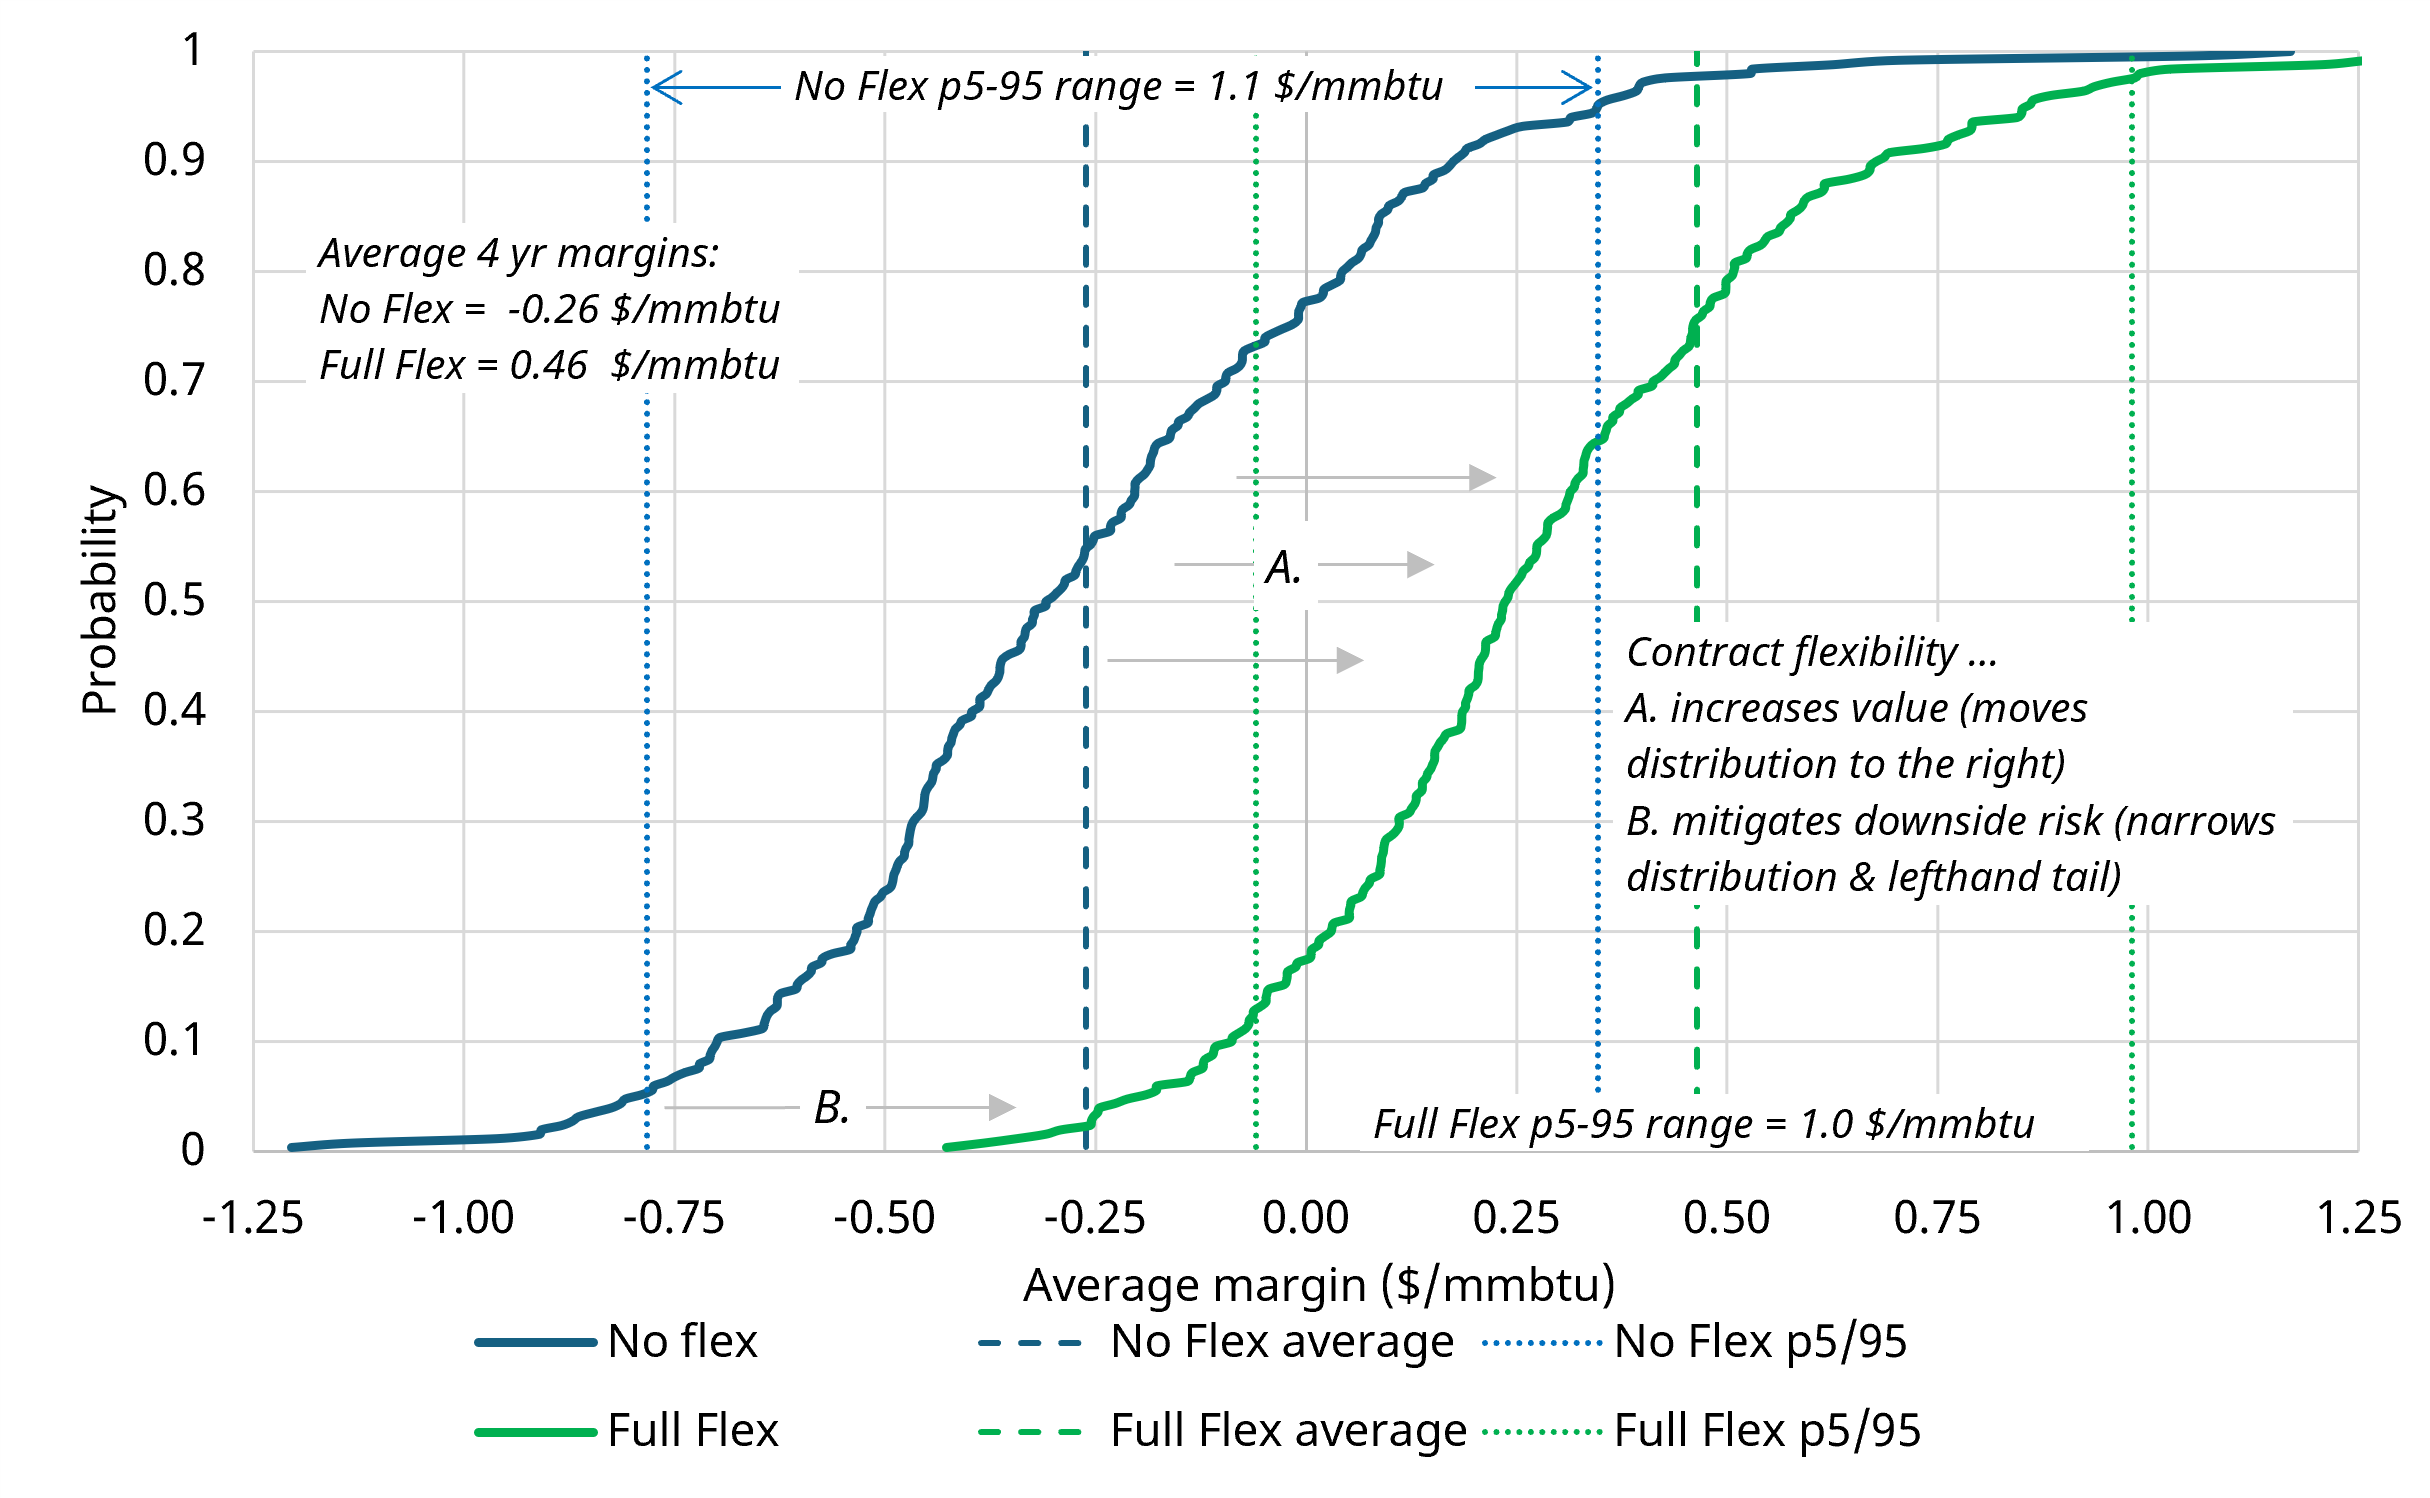
Source: LNG Bridge portfolio valuation model
Flexibility terms materially increase expected margin and reduce downside risk – a difference that becomes increasingly significant as the market moves into the new supply wave.
Chart 3 disaggregates the two key embedded options. The ability to robustly separate the value of different types of embedded flex can provide crucial advantages in negotiations.
Chart 3: Value distributions for (i) cancellation flex & (ii) diversion flex options
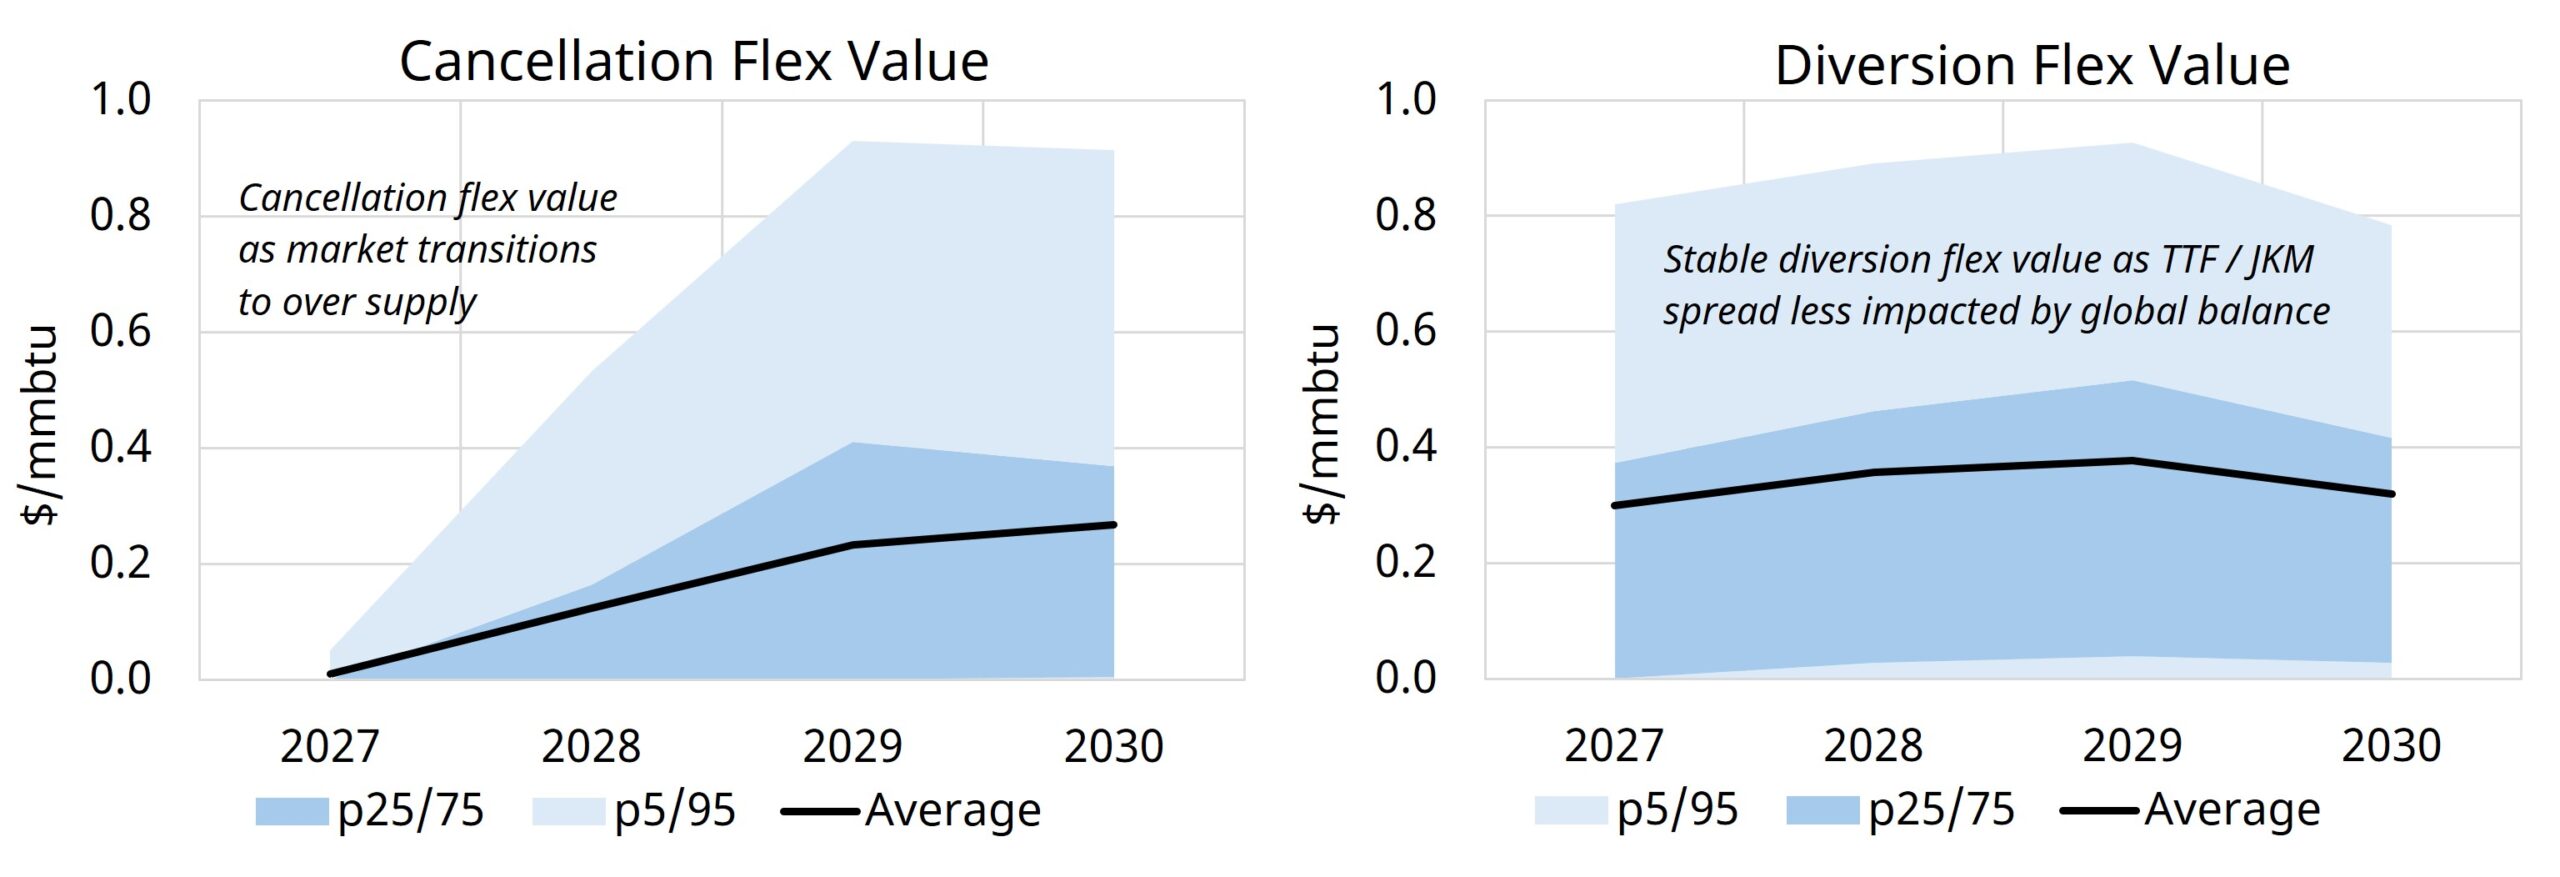
Chart 3: Value distributions for (i) cancellation flex & (ii) diversion flex options
The cancellation option is driven primarily by intrinsic value – its value is low in 2027 when the price signal strongly favours lifting US cargos, but rises materially in 2028–30 as TTF/JKM and Henry Hub prices converge and intrinsic value falls. The increase in value of the cancellation options primarily reflects its benefit as a downside risk mitigant (as illustrated in chart 2 above).
The diversion option, by contrast, is driven by the volatility and correlation of JKM vs TTF price spreads rather than their absolute level – with current crisis conditions having a positive impact on option value.
Chart 4 completes the picture with delta exposures of the contract to underlying traded market price benchmarks. Robust exposure calculations are crucial for both dynamic hedging strategies and trading risk calculations (e.g. Value at Risk).
Chart 4: Contract delta exposures to TTF, JKM and HH Source
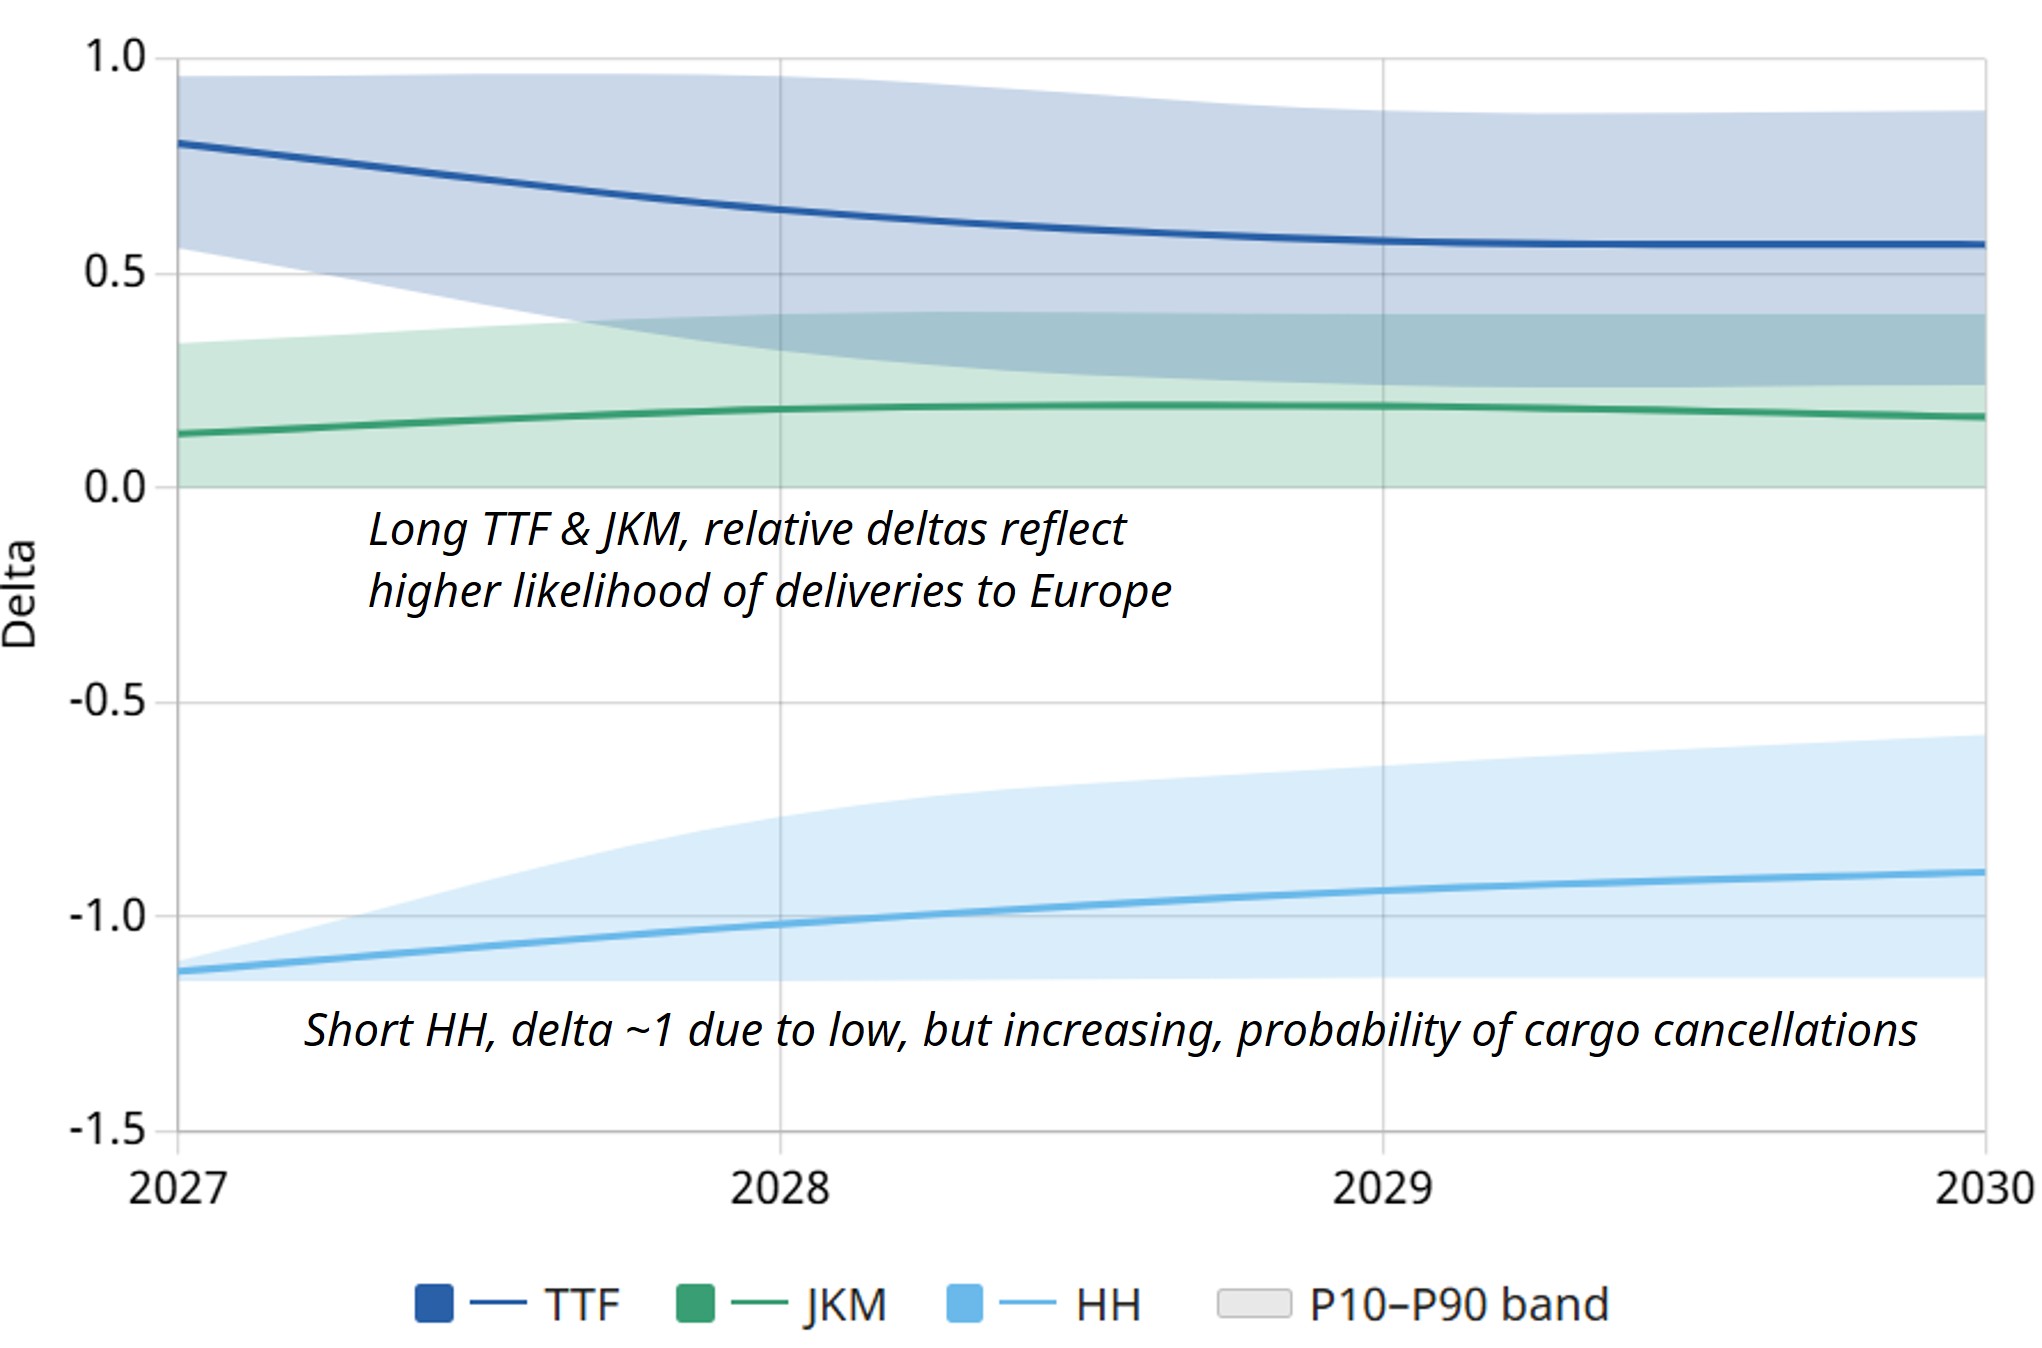
LNG Bridge portfolio valuation model; note 2027 HH delta is < -1.0 given impact of variable liquefaction fee (115% HH)
Henry Hub delta exposures reflect the in-the-moneyness of the contract, with a gradual decline as TTF/JKM prices ease in 2028–29. TTF and JKM deltas capture the market exposure of the delivery leg, based on netback margins from Europe and Asia to the US Gulf Coast.
A dynamic view of these exposures underpins effective hedging and risk management of the contract. Exposures will move significantly and become more volatile as the market rebalances, driving the need for more dynamic hedging strategies underpinned by robust calculation of probabilistic exposures.
Dynamic valuation is underpinned by robust analytics
The case study above is only possible with a genuinely stochastic approach to valuation – one that models price uncertainty across hundreds of scenarios rather than against a single deterministic curve.
In a high-volatility and rapidly moving market, the gap between minimum-standard and robust analytical capability is substantial. The table below summarises that gap across four key dimensions.
Table 1: Minimum vs robust analytical capability across 4 key dimensions
The four dimensions in the table are not independent – they reinforce each other. Robust stochastic valuation only becomes actionable if flexibility is modelled consistently, with exposures calculated at both a deal and portfolio level. In a market shock like the current one, companies that have invested in this analytical foundation can move quickly and with confidence; those that haven’t are left managing risk they cannot properly see.
LNG Bridge portfolio valuation model
The analysis in this article is produced using LNG Bridge, Timera’s stochastic LNG portfolio valuation model. Our LNG Bridge client base covers more than 25% of the physical global LNG market.
LNG Bridge allows companies to quantify and manage the interdependent value of LNG assets within a portfolio. It supports asset investment, deal valuation & structuring, hedging and risk management.
We have just released a major upgrade to the platform – including a redesigned user interface, significantly improved validation, and a greater than 40% improvement in run-times that allows more complex scenarios to be rerun at speed.
The release also introduces enhanced user control over price simulation, allowing more realistic and tailored scenario generation. In a market moving as fast as this one, the ability to run robust stochastic valuations quickly and repeatedly is not a luxury – it is a core operational requirement.
For more information on LNG Bridge and our LNG consulting services contact David Duncan — LNG & Gas Director (david.duncan@timera-energy.com).