Relative shifts in gas vs crude pricing is one of the key drivers of LNG portfolio value.
The LNG market was formed around long term oil-indexed contracts. Oil indexation remains prominent, particularly in Pacific Basin LNG contracts. But the market value of this contracted LNG is now driven by liquid gas hubs (e.g. TTF, JKM).
The fact that large volumes of LNG are still purchased on an oil-indexed basis means that relative swings in oil vs gas prices have a substantial value impact on LNG Sale & Purchase Agreements (SPAs).
Relative oil vs gas pricing is also an important driver of the value of flexibility in oil-indexed SPAs (e.g. volume flex & cancellation rights). This relationship is less well understood and value is often left on the table as a result.
In this article we explore these dynamics using a practical case study of a Brent indexed SPA based on current forward market prices. We set out:
- Current oil vs gas pricing dynamics (e.g. Brent vs JKM)
- The value breakdown of a 5 year Brent indexed SPA
- The drivers of different components of SPA flex value
- Commercial conclusions on managing contract value & risk.
Gas vs oil prices: a wild ride
There is nothing like an energy crisis to destroy traditional correlations between oil & gas prices. Chart 1 illustrates the wild ride across the last 3 years. You’ll have to forgive us for cutting the chart off at 60 $/mmbtu given we don’t have the space to show the 2022 price spikes towards 100 $/mmbtu.
Chart 1: Global gas & oil price benchmarks
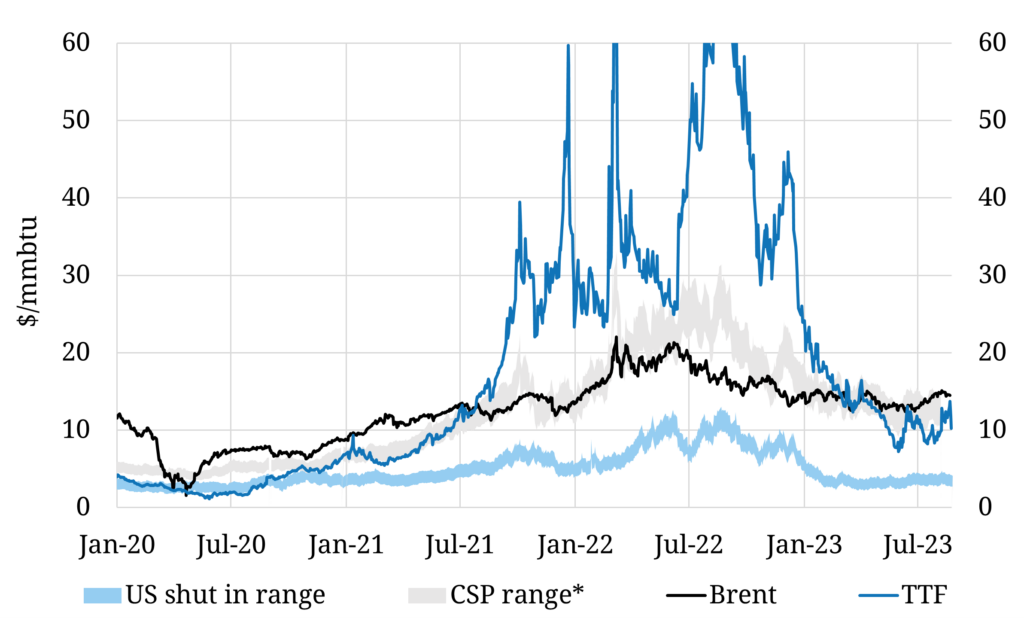
Source: Timera Energy, ICE
The chart shows the relatively strong pre-crisis relationship between TTF hub prices (the dark blue line) that anchors global LNG prices and two important underlying drivers:
- Brent indexed contract pricing benchmark (black line)
- European coal for gas switching range (grey shaded area).
The influence of these two drivers was blown away in Summer 2021 as Russia dialled back its exports to Europe and the gas crisis commenced.
Huge volatility in gas prices relative to oil has driven substantial swings in oil-indexed SPA value across 2021-22. As a period of relative calm has returned into Summer 2023, TTF has reconverged with both the Brent benchmark and the coal switching range.
But don’t be fooled into thinking things have returned to a pre-crisis ‘normal’. The gas market remains tight until at least late 2025 and gas price volatility is likely to stay for the next 2-3 years until the next wave of LNG supply arrives (2026-28).
So lets take a look at the current state of play for the value & risk of a case study Brent indexed SPA.
A case study demonstrates value drivers
The market volatility shown in Chart 1 has posed major challenges for the buyers & sellers of Brent indexed LNG supply. The flexibility negotiated into these contracts to leverage value & mitigate risks has never been so important & valuable. Common SPA flexibility terms include volume flex, delivery window flex and cargo cancellation rights.
Understanding SPA value drivers feeds into the management of existing contracts, negotiation of new contracts and strategy for price reopeners.
Let’s consider the value of a 5 year (2024-28) Brent indexed DES sale into North East Asia with 16.5% slope co-efficient (% of the Brent price paid for the LNG). From an exposure perspective the seller of this contract is short JKM and long Brent. The relative gas vs oil price dynamics that underpin the SPA are summarised in Chart 2, based on current forward market prices.
Chart 2: Brent vs JKM price benchmarks
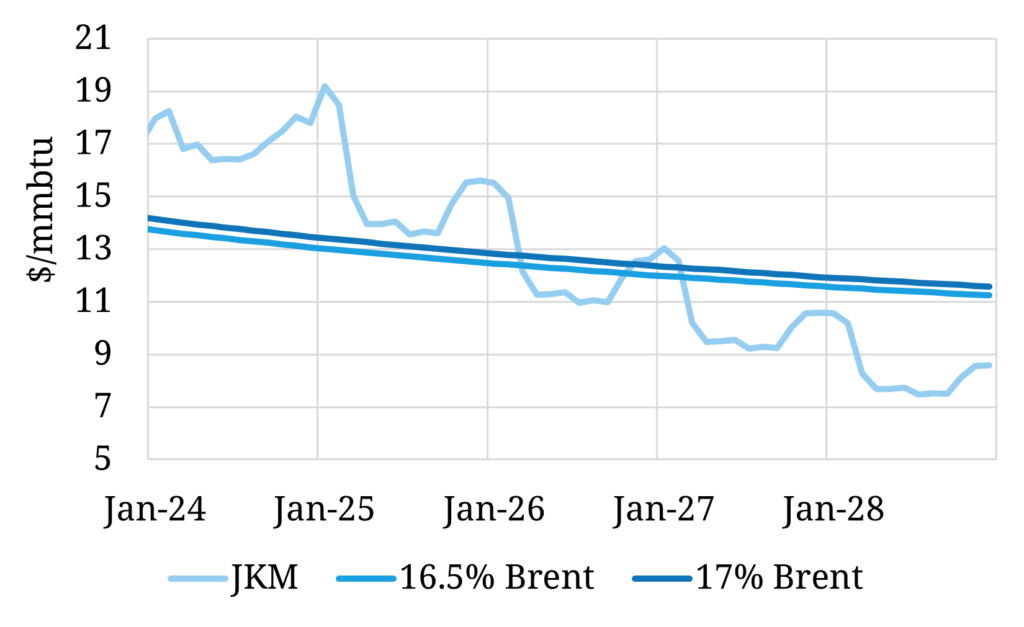
Timera Energy
Current forward Brent prices imply an average 17% slope across the deal horizon as being ‘at the money’ against JKM spot prices. Our case study SPA with a 16.5% slope is therefore marginally ‘out of the money’ on a slope basis. But this is only one of a number of factors driving the SPA value and risk.
Other important factors include:
- Differential between Brent slope purchase price vs JKM market price (SPA is ‘in the money’ across first half of contract horizon & ‘out of the money’ across the latter half – as can be seen in the chart)
- The impact of JKM curve seasonality vs a ‘flat’ Brent curve (also clear in the chart)
- The relative levels of correlation & volatility between Brent & JKM (important drivers of the value of SPA flexibility terms).
Good luck considering those in your head – you need a sophisticated probabilistic model to analyse contract value. Our LNG Bridge portfolio model is used by a range of leading LNG companies for exactly this purpose. Let’s look at some model results from LNG Bridge to better understand value & risk drivers.
Brent indexed SPA value component breakdown
Chart 3 shows a waterfall breakdown of total average SPA margin, converted to a % Brent slope (left hand axis) and shown in $/mmbtu value terms (right hand axis). How do you interpret the chart:
- The left hand bucket shows value assuming no contract flexibility i.e. SPA is 0.5% ‘out of the money’ in Brent slope value terms (or 0.4 $/mmbtu in gas value terms)
- Then flex value is layered on across the subsequent 3 buckets to give a total SPA value (including flexibility terms) of 1.1% ‘in the money’.
Chart 3: Brent SPA value breakdown in Brent slope terms
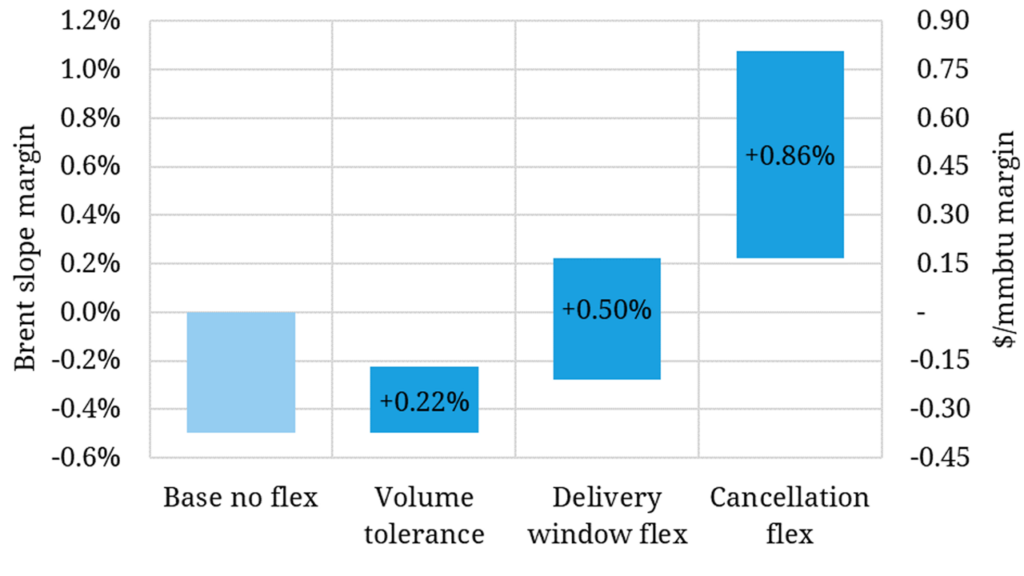
Source: Timera’s LNG Bridge model
A summary of SPA assumptions:
- Baseline (left hand bucket) = simple rateable 12 cargo per year deal with no flexibility
- Then add volume flex from 3.7TBTu fixed, to 3.5-3.9 TBTu (2nd bucket)
- Then add delivery window flex i.e. can profile 7 cargos into summer vs 6 (3rd bucket)
- Finally add cancellation flex i.e. DQT of 2 cargo.
What about contract risk?
LNG Bridge also produces value distributions for SPAs. Chart 4 shows the value / risk distribution of the baseline Brent SPA (assuming no flexibility terms) vs the full SPA (including flexibility terms).
Chart 4: Brent SPA value / risk distribution (no flex vs full flex)
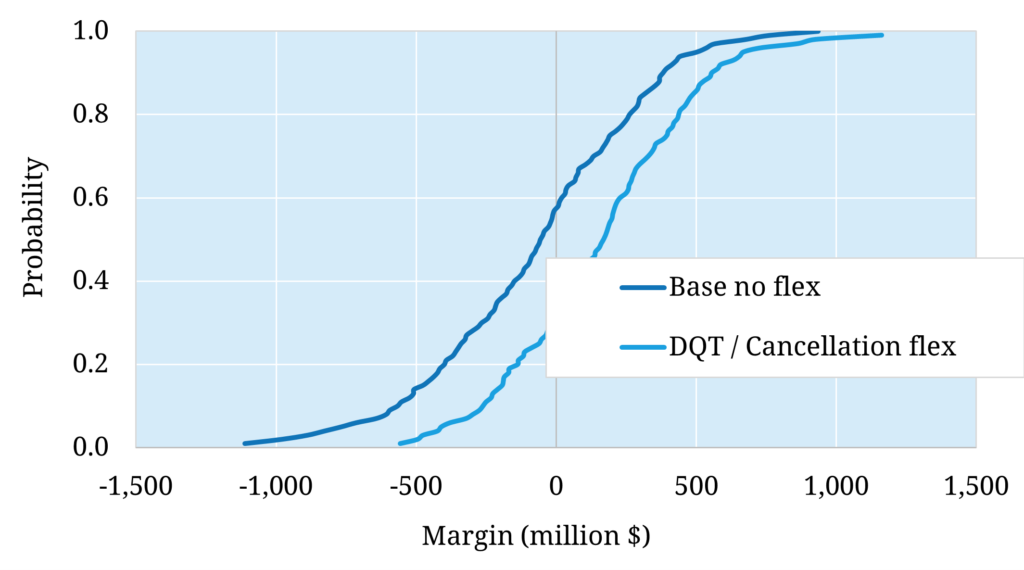
Source: Timera’s LNG Bridge model
A few observations on value & risk that can be drawn from this distribution analysis:
- Flexibility terms add a $220m expected margin uplift to the SPA (equivalent to 0.81 $/mmbtu or 1.08% Brent slope)
- The SPA has a wide risk distribution (P90-P10 of > $800m) due to the relatively low correlation between Brent & JKM
- The biggest impact on P10 as cancellation flex mitigates downside (more valuable at start of horizon where the Brent indexed sale is out of the money against the JKM indexed spot market on an intrinsic basis).
Chart 4 shows the high level of risk associated with an unhedged Brent SPA. But there are a range of risk management options that can be implemented to pull in this risk distribution e.g. forward hedging of the Brent index exposure.
Key takeaways on Brent SPA value & risk
Let’s finish by setting out some key considerations on Brent SPA value given the current market set up:
- High flex value: A lower correlation between Brent & JKM is driving an increase in value of SPA flexibility terms.
- Value breakdown depends on price: Contract value can be intrinsic value if the SPA is deep in or out of the money, or extrinsic value if the SPA is at the money.
- Volatility driving risk: High gas price volatility is also causing substantial shifts in SPA value, increasing risk & the importance of effective contract management e.g. via portfolio optimisation or hedging.
- Fundamentals key: Market regime shifts are having a structural impact on SPA value e.g. shifts in price setting role of Asian LNG flexibility (e.g. switching vs oil products in industry) directly impact oil vs gas price correlations (impacting SPA management & negotiations)
- Portfolio construction: Oil-indexed SPA value & risk needs to be analysed in an LNG portfolio context; there are typically important interactions with other portfolio assets & the lower relative volatility of Brent (vs gas) may even be interesting from a portfolio risk diversification perspective.
Hub indexation of LNG contracts is increasing its penetration. But large volumes of LNG remain in oil-indexed SPAs. Being able to quantify SPA value dynamics & manage risks (including portfolio interactions) can be a big source of value creation and competitive advantage for LNG portfolios.
See here for more details on:
- Our LNG Bridge portfolio model
- Our quarterly gas subscriptions data & analysis service
David Duncan (LNG & Gas Director) will be speaking at Gas Tech in Singapore this week: 5th Sep 14:45
Topic: “New market regime a game changer for LNG portfolio strategy.”
Please get in touch if you would like to catch up with David in Singapore on the services Timera Energy provide.
📩 david.duncan@timera-energy.com