“The LNG market has ducked 3 geopolitical punches while switching dominates pricing”
2025 has had its share of geopolitical drama. Geopolitics can rattle energy markets in the moment, but fundamentals tend to reassert themselves quickly.
The LNG market has shaken off 3 major geopolitical punches so far this year, in the form of the ‘Trump tariff tantrum’, the Israel-Iran-US conflict & more recent attempts at a Russia – Ukraine peace deal.
Fundamental drivers of LNG market supply & demand balance have dominated market evolution. Since prices receded in Q1 as winter fears eased, European power sector and Asian oil-linked switching flexibility have been acting as powerful marginal price setting anchors.
In today’s article we use 5 charts to summarise the current state of the LNG market and the path into what is set to be a major market regime shift in 2026-27.
1. Relative price stability in summer 2025 driven by switching anchors
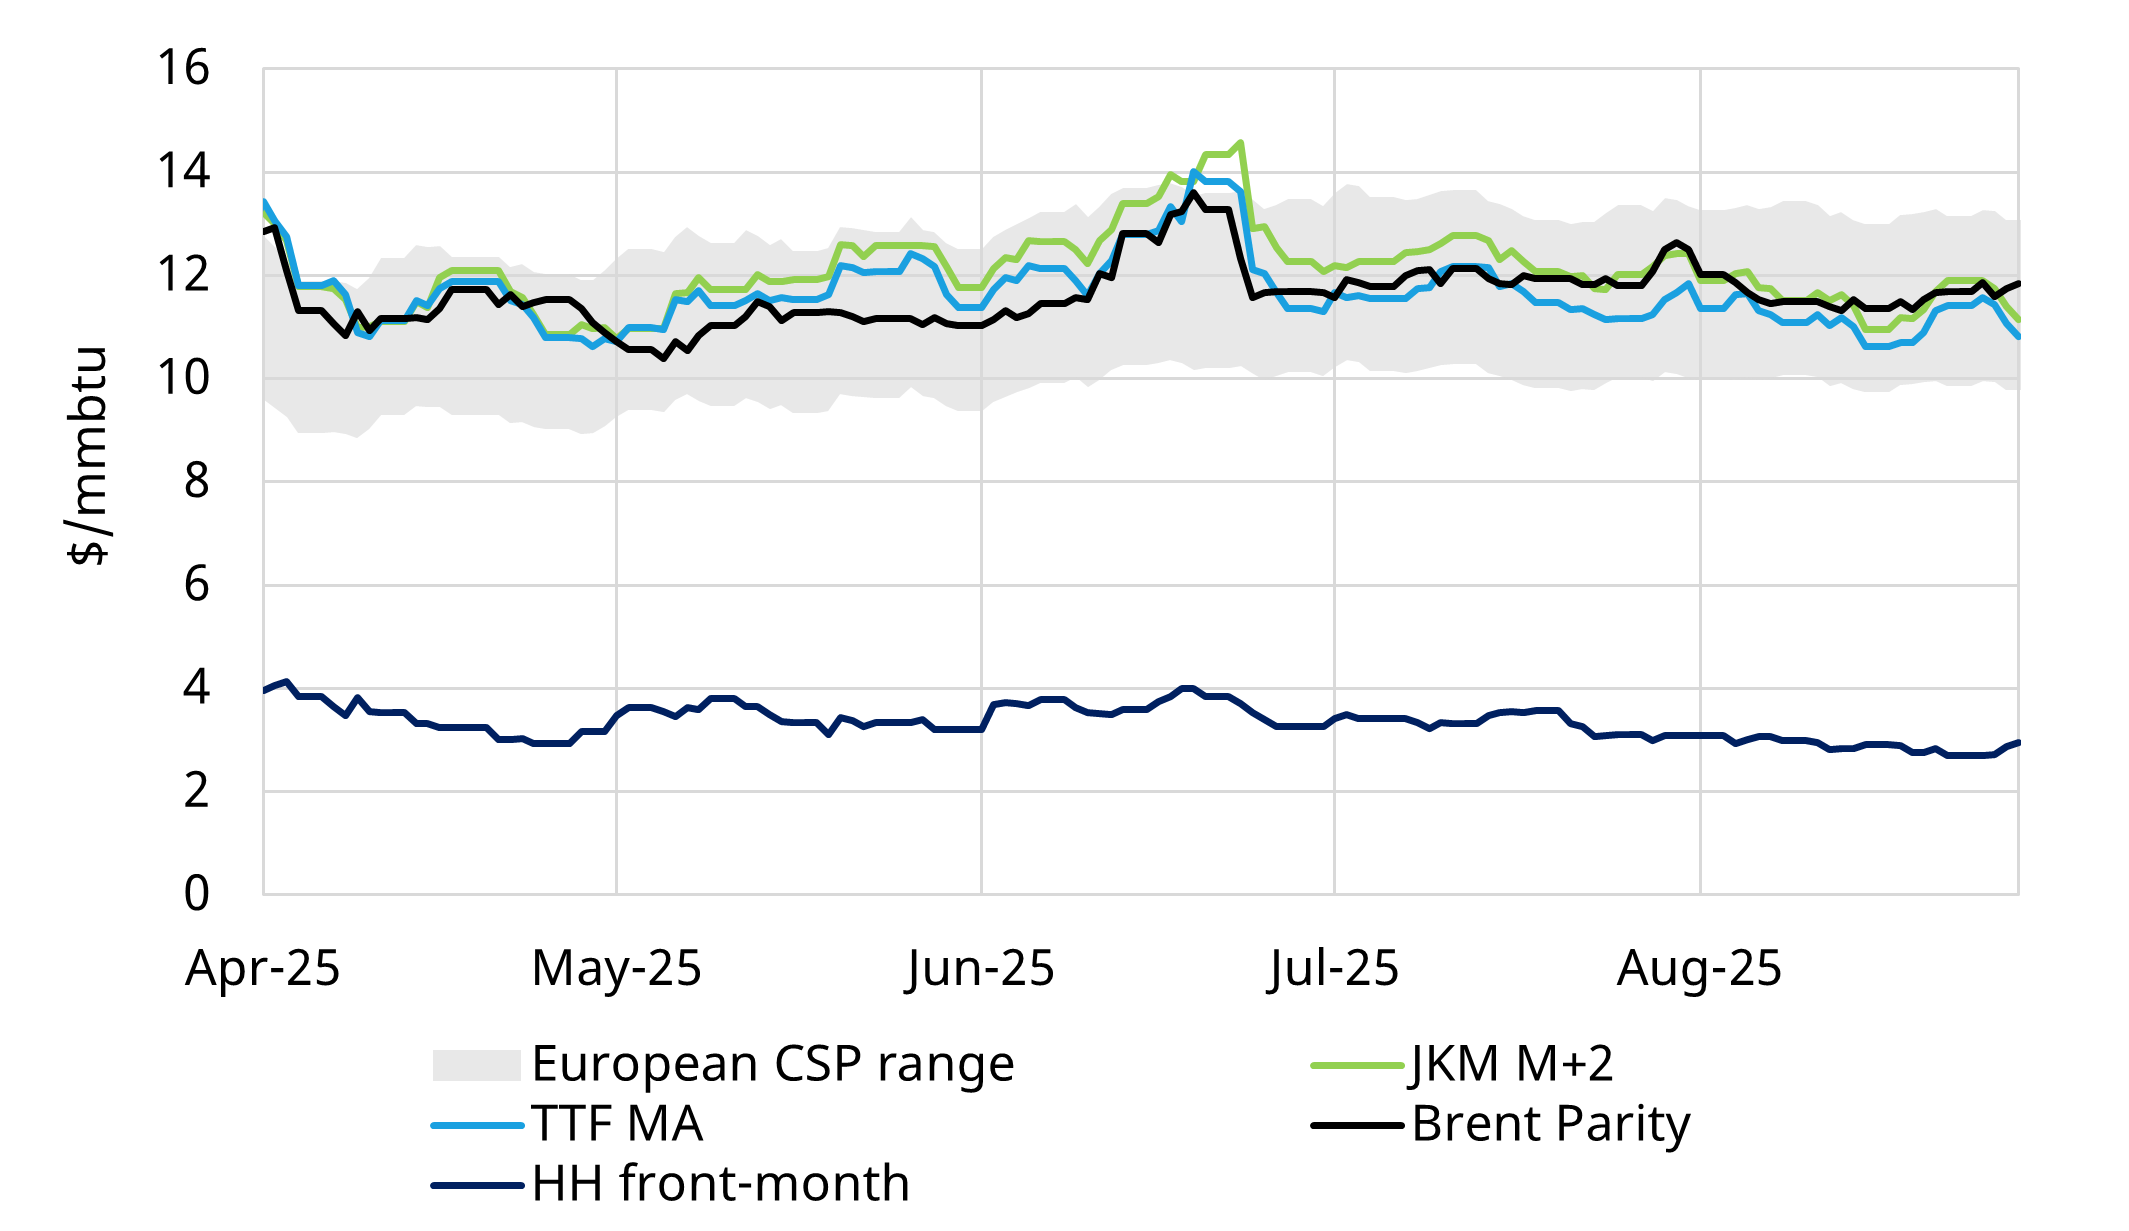
Chart 1 shows the evolution of key global gas price benchmarks (JKM, TTF & Henry Hub) over the summer to date.
Two key switching benchmarks are overlaid: (i) the European gas for Coal Switching Price (CSP) range and (ii) Brent crude parity (a proxy for Asian oil to gas switching range). Chart 1 shows the powerful force of European & Asian switching in anchoring gas price movements as flexibility responds at the margin.
Chart1: Global gas price benchmarks
Source: Timera Energy, ICE, CME, ECB
Growth fears linked to the ‘Trump tariff tantrum’ global market sell off in Apr 2025 saw JKM & TTF prices ease from 14 to 11 $/mmbtu. Then the short lived Israel-Iran-US conflict in Jun 2025 temporarily pushed prices back up to the 14 $/mmbtu level.
Prices eased into Jul 2025 with the dissipating risk of kinetic conflict in the Middle East. They have then remained relatively stable around an 11-12 $/mmbtu level, with minimal recent Russia – Ukraine ceasefire discussions having minimal impact.
2. European storage inventories low into summer.. but refilling fast
A major European storage drawdown was a key driver of upwards pricing pressure last winter. As a result Europe faced a major storage refill challenge at the start of this summer, which has helped to support prices.
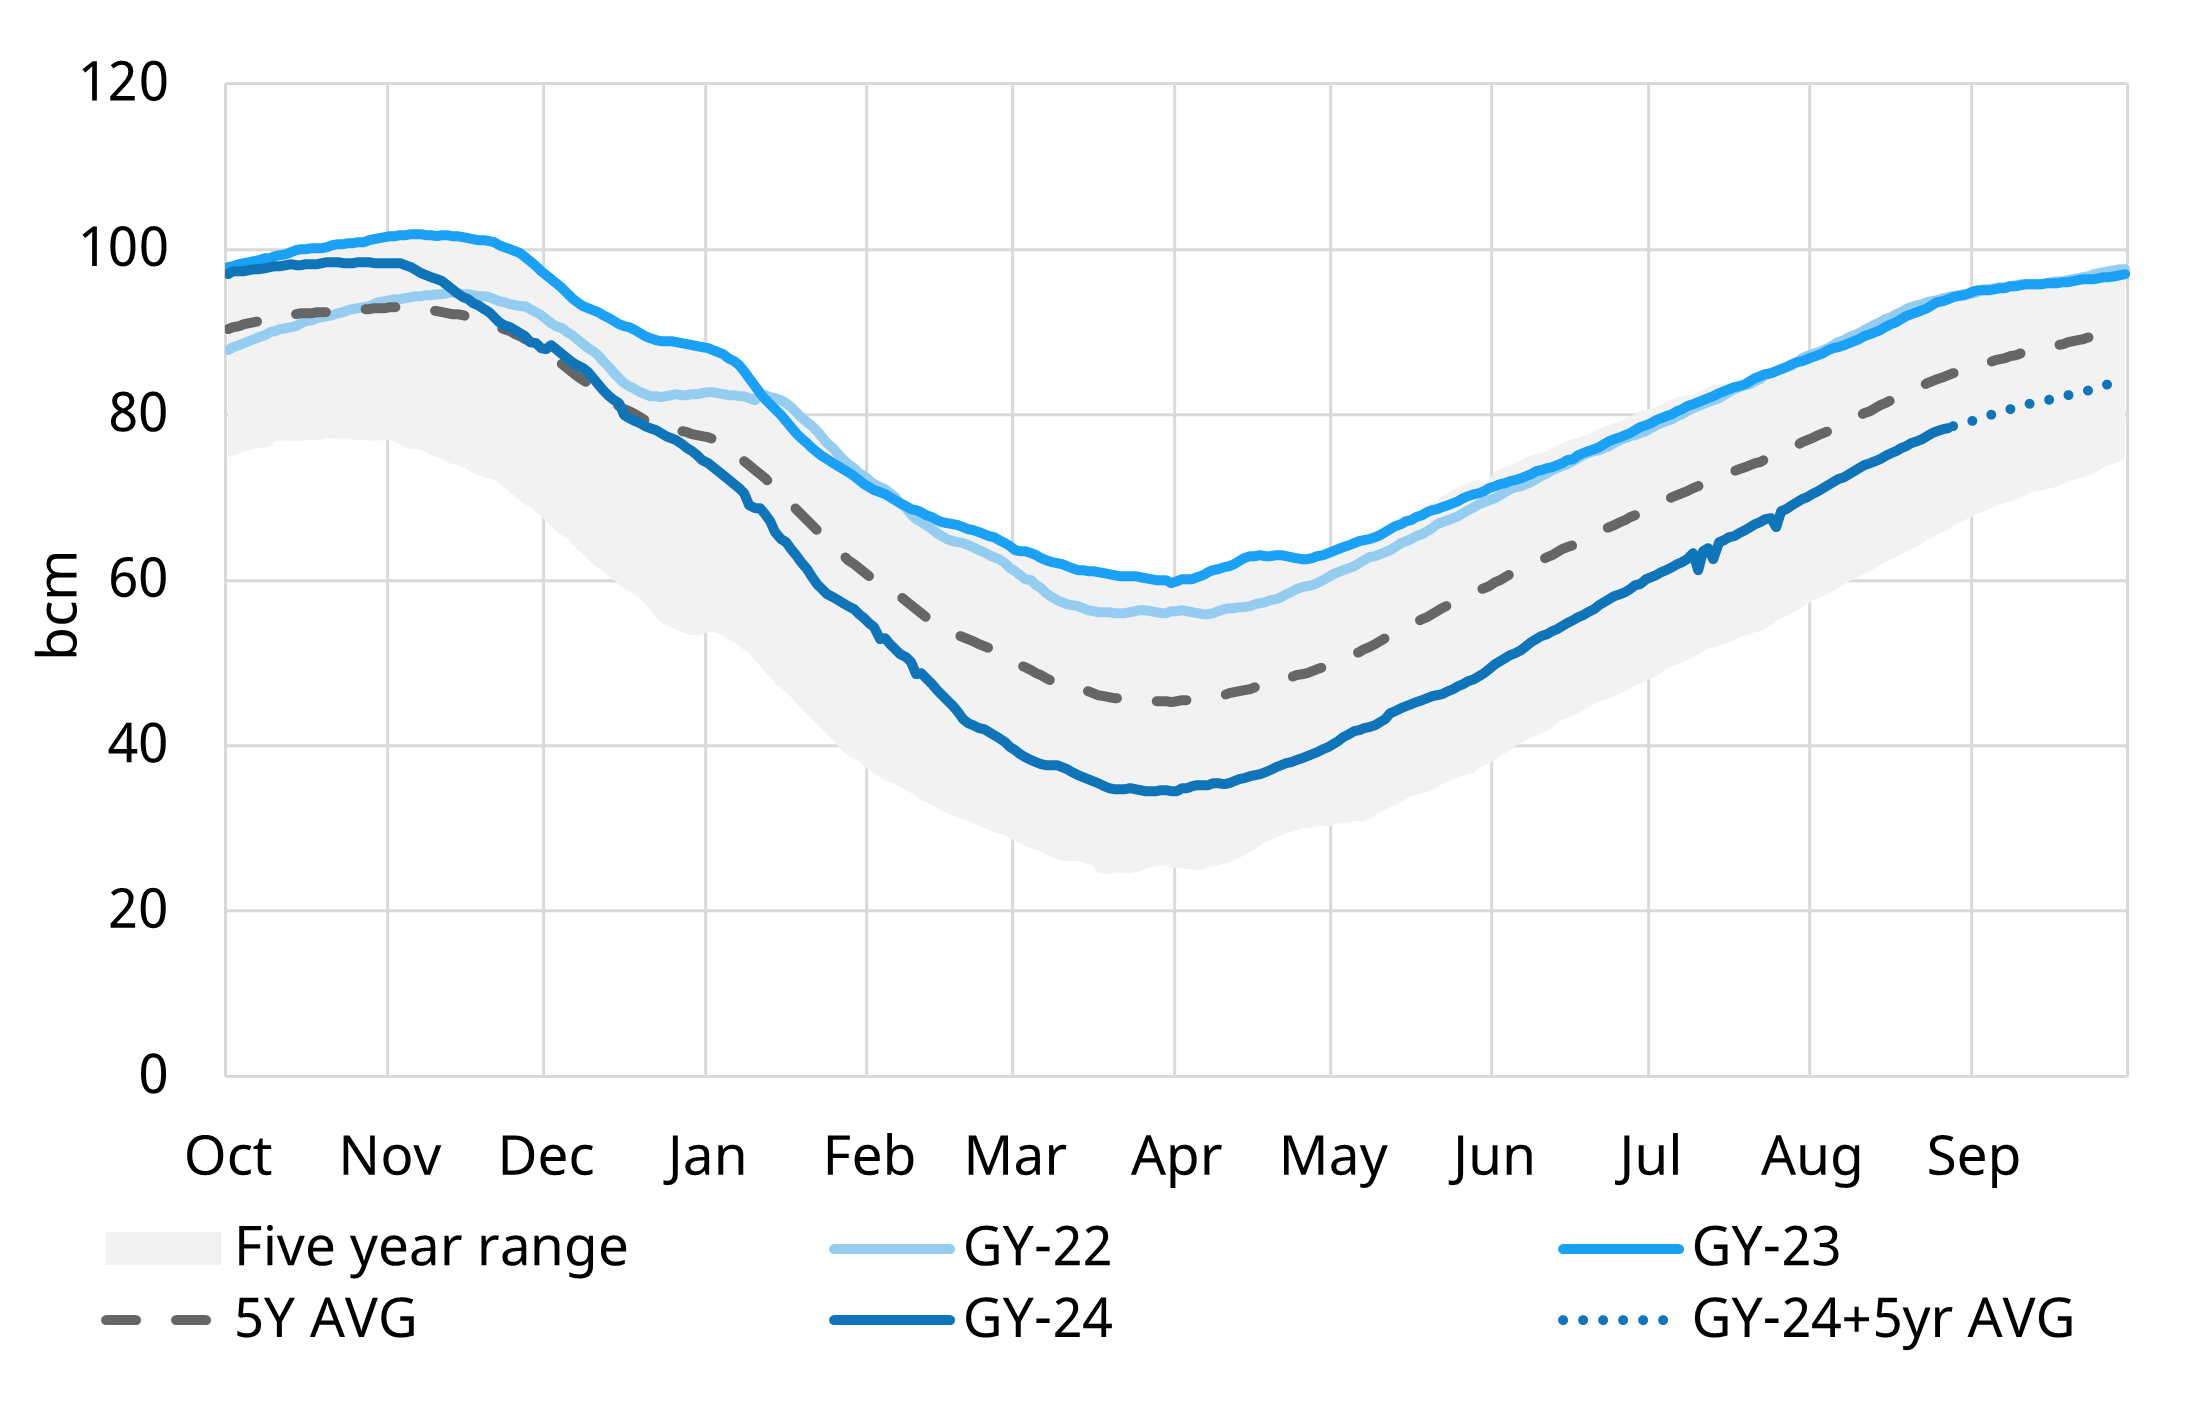
However Chart 2 shows that aggregate European storage inventories have started to reduce the year-on-year deficit.
Chart 2: Aggregate European underground storage inventories
Source: Timera Energy, AGSI
Underground gas stocks in Europe currently sit at 78 bcm, or 75% full, after exiting winter at 35 bcm. This is 16 bcm lower year on year, a reduction in the 25 bcm deficit that stocks exited winter at.
On the current refill trajectory Europe will meet storage mandate levels, quelling upwards price pressure. However Europe will enter this winter with significantly lower gas storage buffer than last year.
3. Europe is absorbing large volumes of LNG
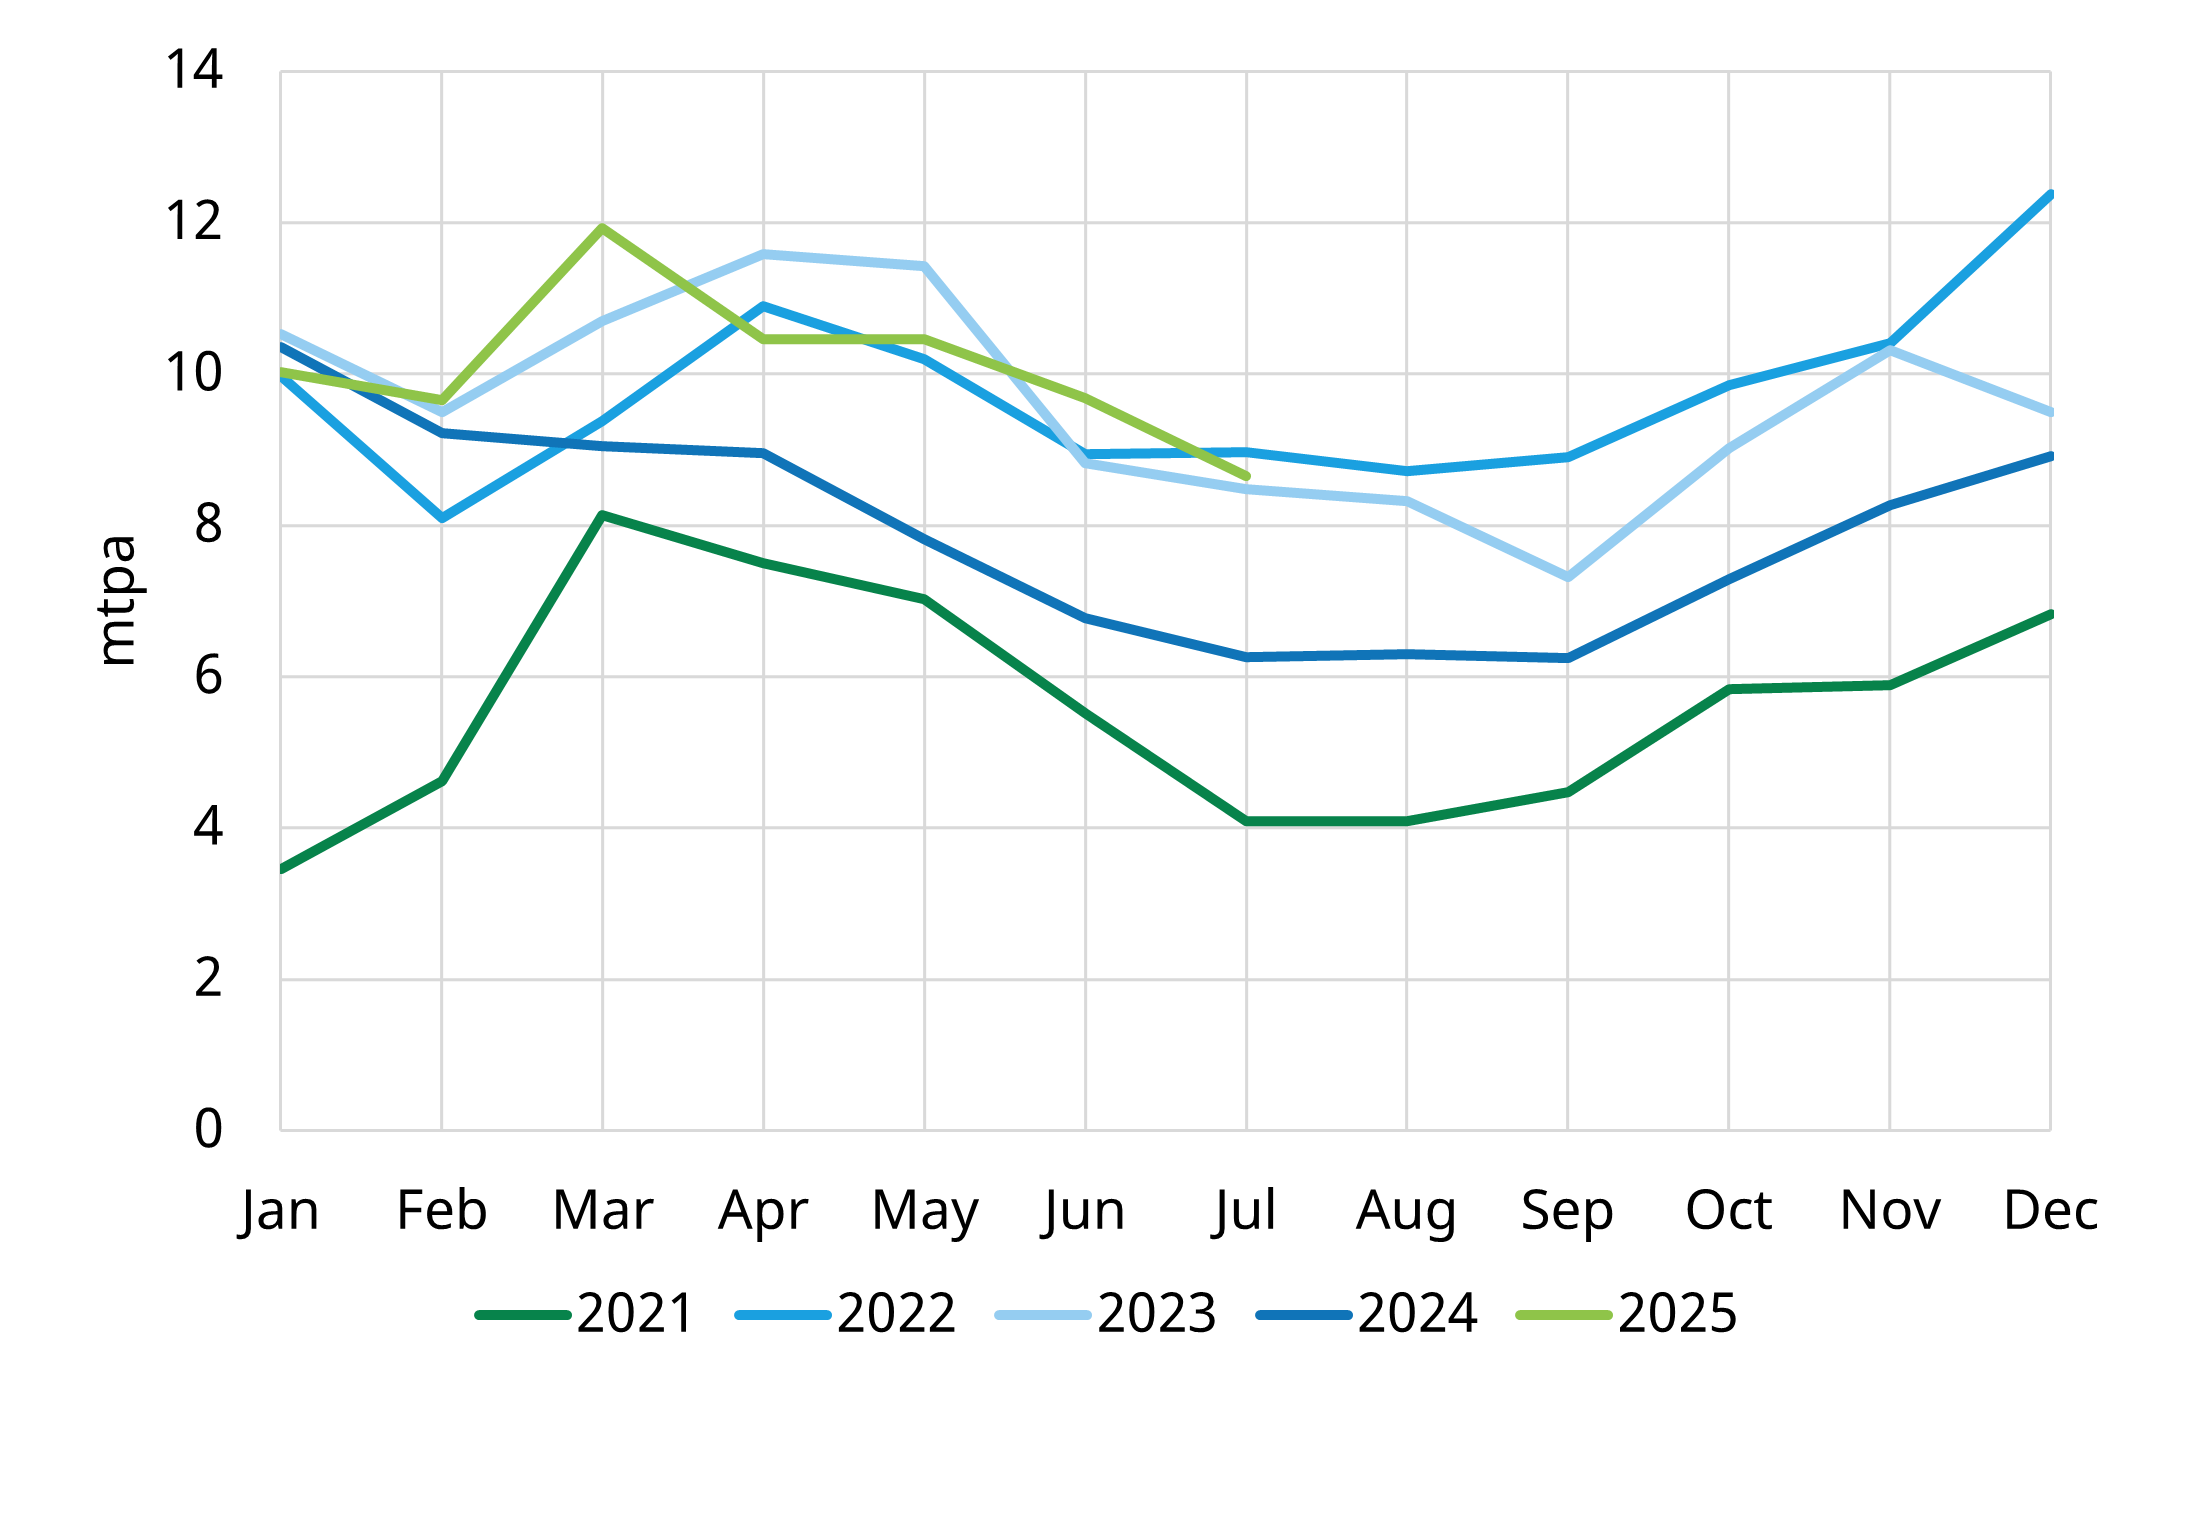
European storage refill has been achieved thanks to near record European LNG imports in 2025 as shown in Chart 3.
Chart 3: European LNG import volumes (year-on-year)
Source: Timera Energy, LNG Unlimited
The availability of LNG flowing to Europe is in large part down to lower Asian LNG demand, driven in part by the ongoing backdrop of robust prices.
Chinese imports are down 19% (- 9 mtpa) year-to-date compared to 2024. The new supply wave has yet to really gather pace with global LNG supply only up 9.5 bcm year-on year.
4. Asian LNG demand softness in 2025 has been driven by China
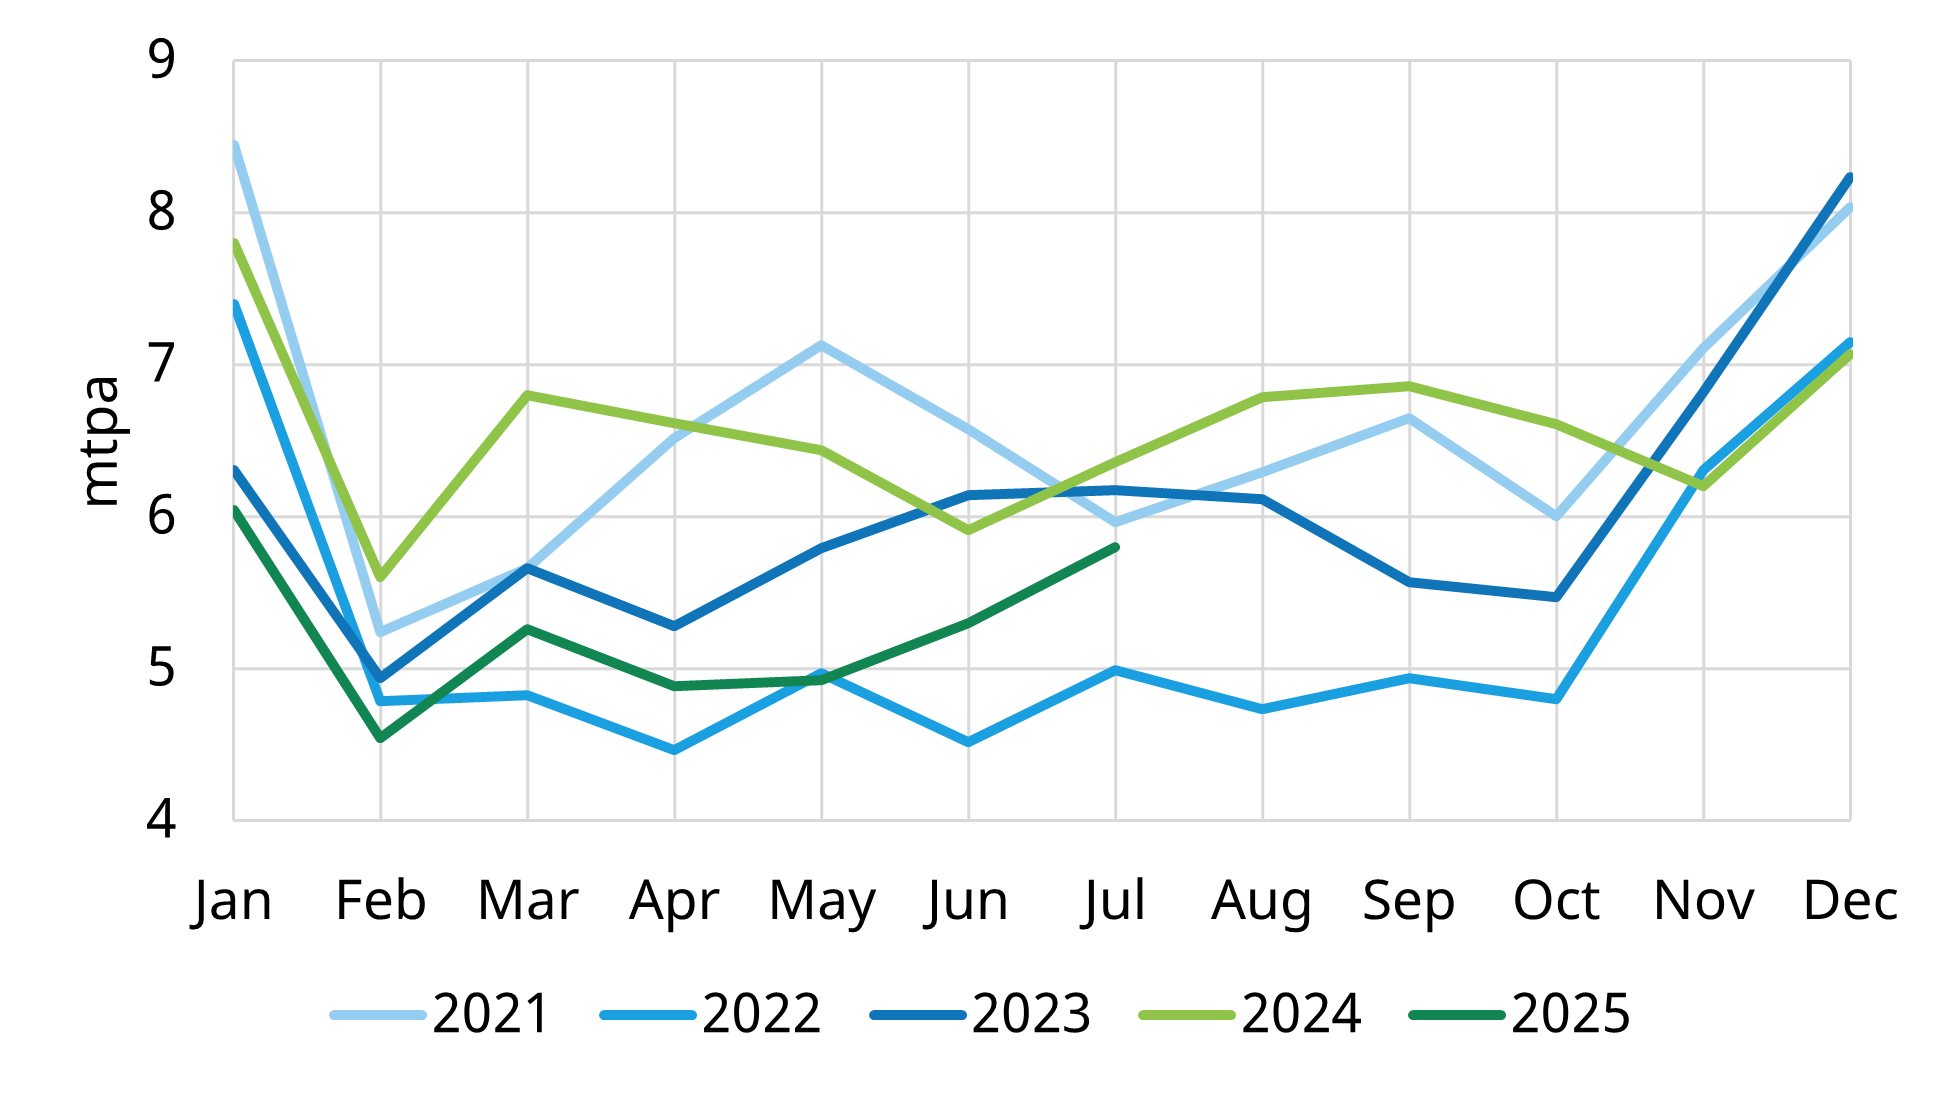
China’s LNG import weakness has continued across the summer as shown in Chart 4. There are some signs of recovery in recent months but imports are still well down vs 2024.
Chart 4: Monthly Chinese imports
Source: Timera Energy, LNG Unlimited
Softer Chinese & Asian LNG demand have reduced competition with Europe for flexible cargoes.
5. Forward curves reflect supply & demand balance into 2026-27
The primary focus of the LNG market remains on the huge wave of new supply ramping up into 2026, with more than 200mtpa of new capacity due online by 2030.
‘Next wave’ supply growth has already started in 2025, but these volumes have been somewhat offset so far by losses to Russian pipe supply due to the end of Ukrainian transit agreement.
As 2025 progresses into 2026 however, rate of year-on-year growth in LNG supply is set to accelerate. This is reflected in the shape of the TTF forward curves shown in Chart 5.
Chart 5: TTF forward curve evolution across Summer 2025
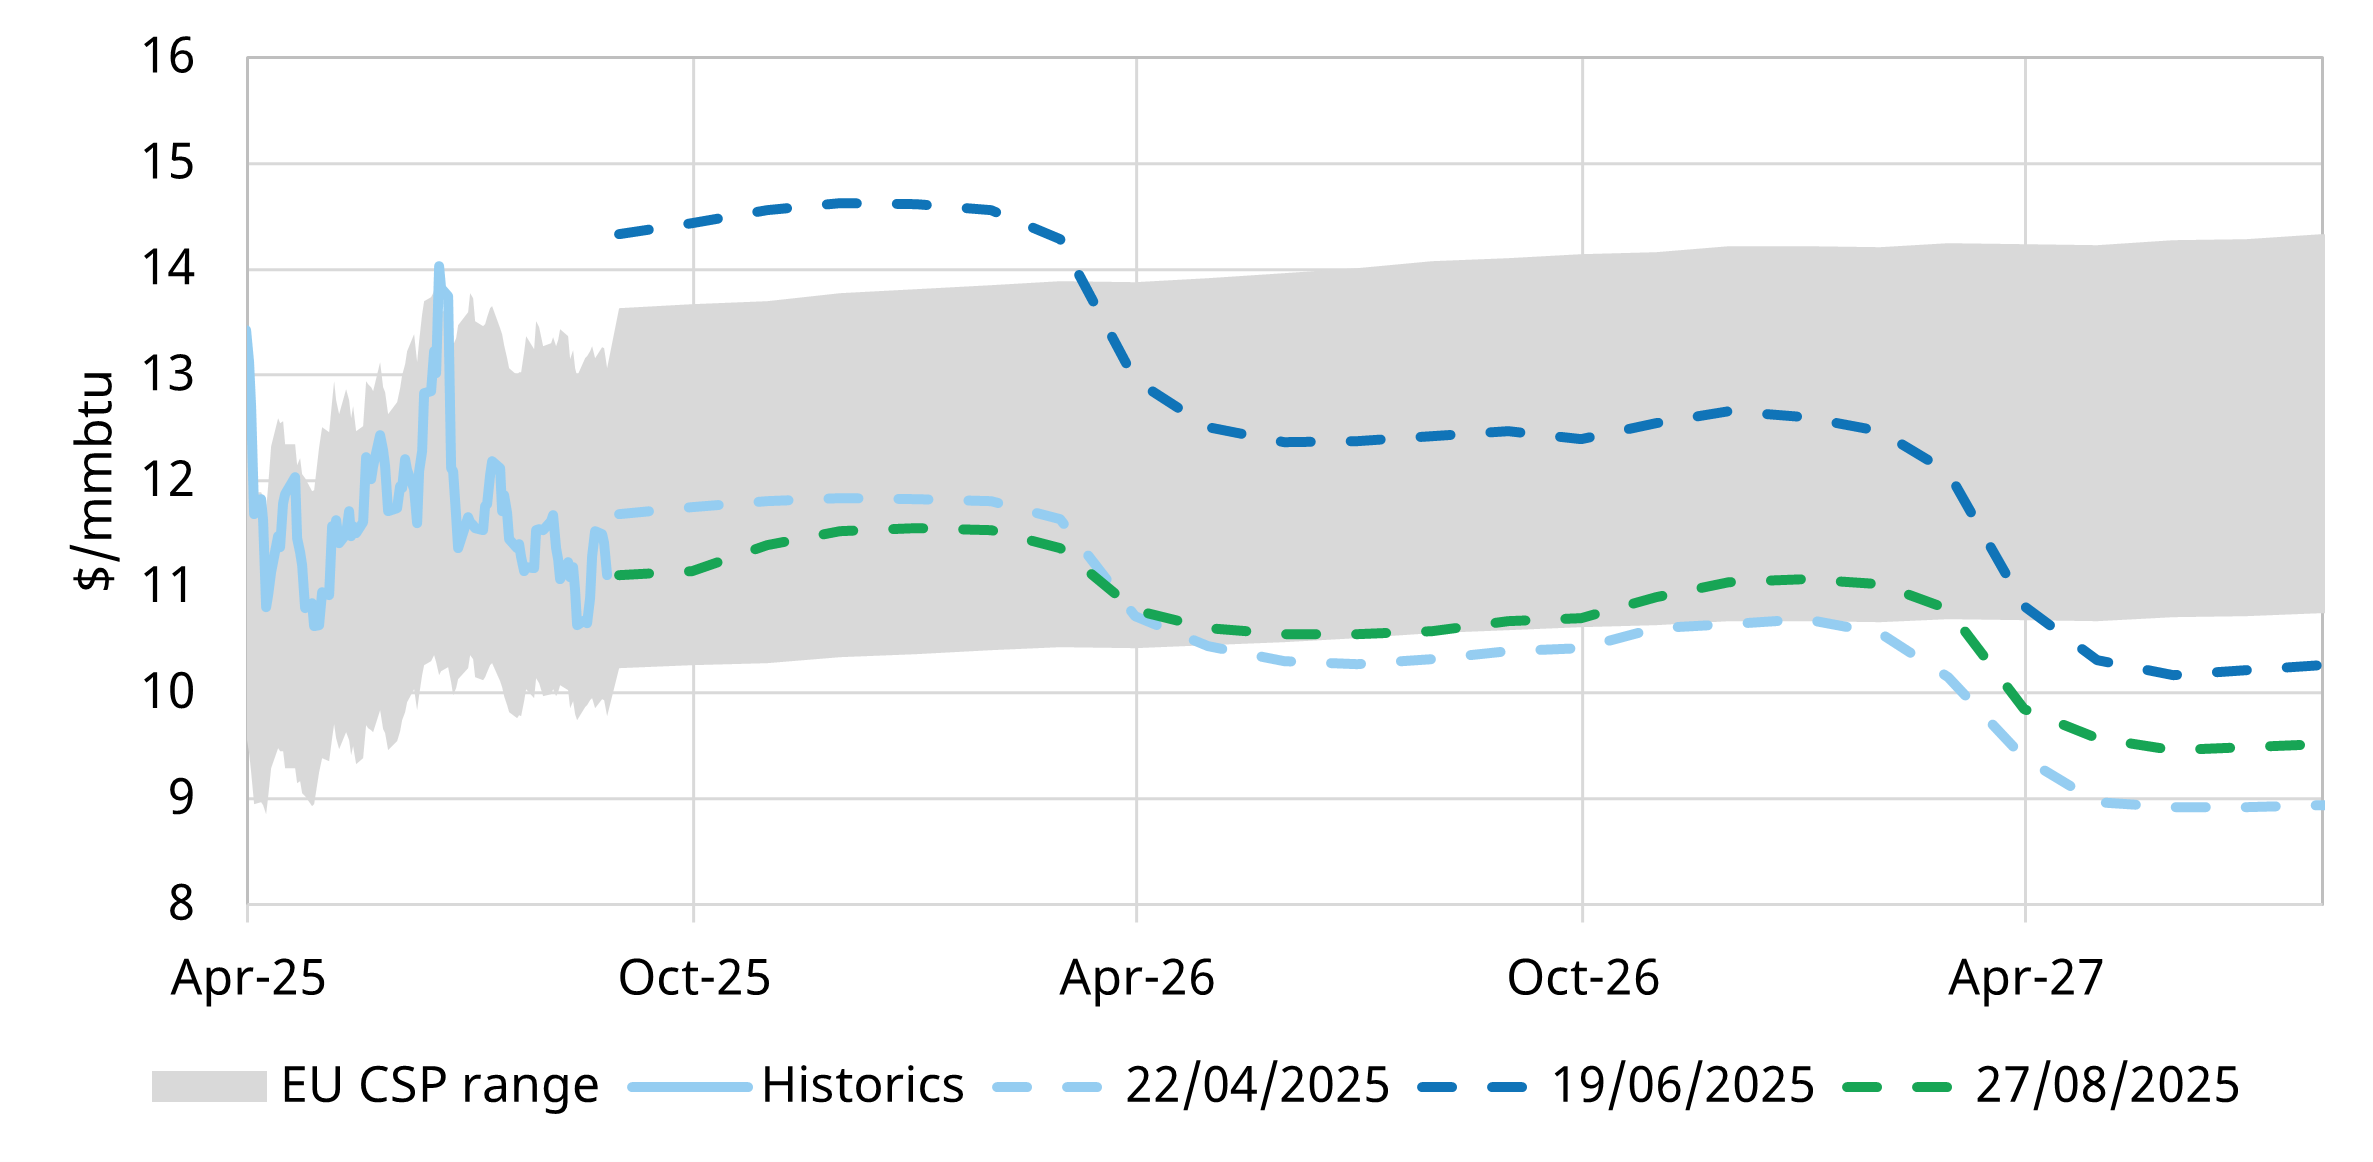
Source: ICE, ECB
TTF & JKM forward curves have given up gains from the Middle East risk premium in June, with curves back at similar levels to April.
Near term uncertainty is causing some volatility in the front of forward curves. However expectations of new supply are causing pronounced curve backwardation and acting to dampen price movements into 2026-27.
Given Europe is set to go into winter with storage inventories short of full, asymmetric upside risk remains across winter from cold weather or supply delays / disruption. This could spark strong competition between Asia and Europe for flexible LNG through winter.
However if the LNG market sails through winter without any tightening events there could be a steeper price drop into next summer than currently reflected in forward curves.
The scale of price reversion across 2026-27 will be driven in large part by Asian LNG demand responsiveness. David Duncan will explore this in more detail in his presentation at Gastech in Milan next week on ‘Absorbing the new supply wave’ (14:00 CET Tue). If you are at Gastech feel free to reach out to David (david.duncan@timera-energy.com) or come and drop by our stand (Hall 5, Stand D136).