“Charter rates drive netbacks & portfolio flex value”
LNG vessel charter rates hit record lows in 2025. The glut stems from an oversupply of vessels, liquefaction project delays, and shorter voyage durations.
Charter rates materially impact LNG portfolio value capture. They are a key component of delivered cargo costs and netbacks, and they shape portfolio arbitrage and flexibility value.
In today’s article we use our LNG Bridge portfolio valuation model to demonstrate the value and risk impact of spot shipping exposure on a representative LNG portfolio.
Capacity glut compressing charter rates
Chart 1 shows the evolution of spot Atlantic LNG vessel charter rates (green line, Spark Commodities 30S contract) versus “fleet abundance” (blue line, a measure of current and ordered vessels).
Chart 1: Atlantic charter rates vs fleet abundance
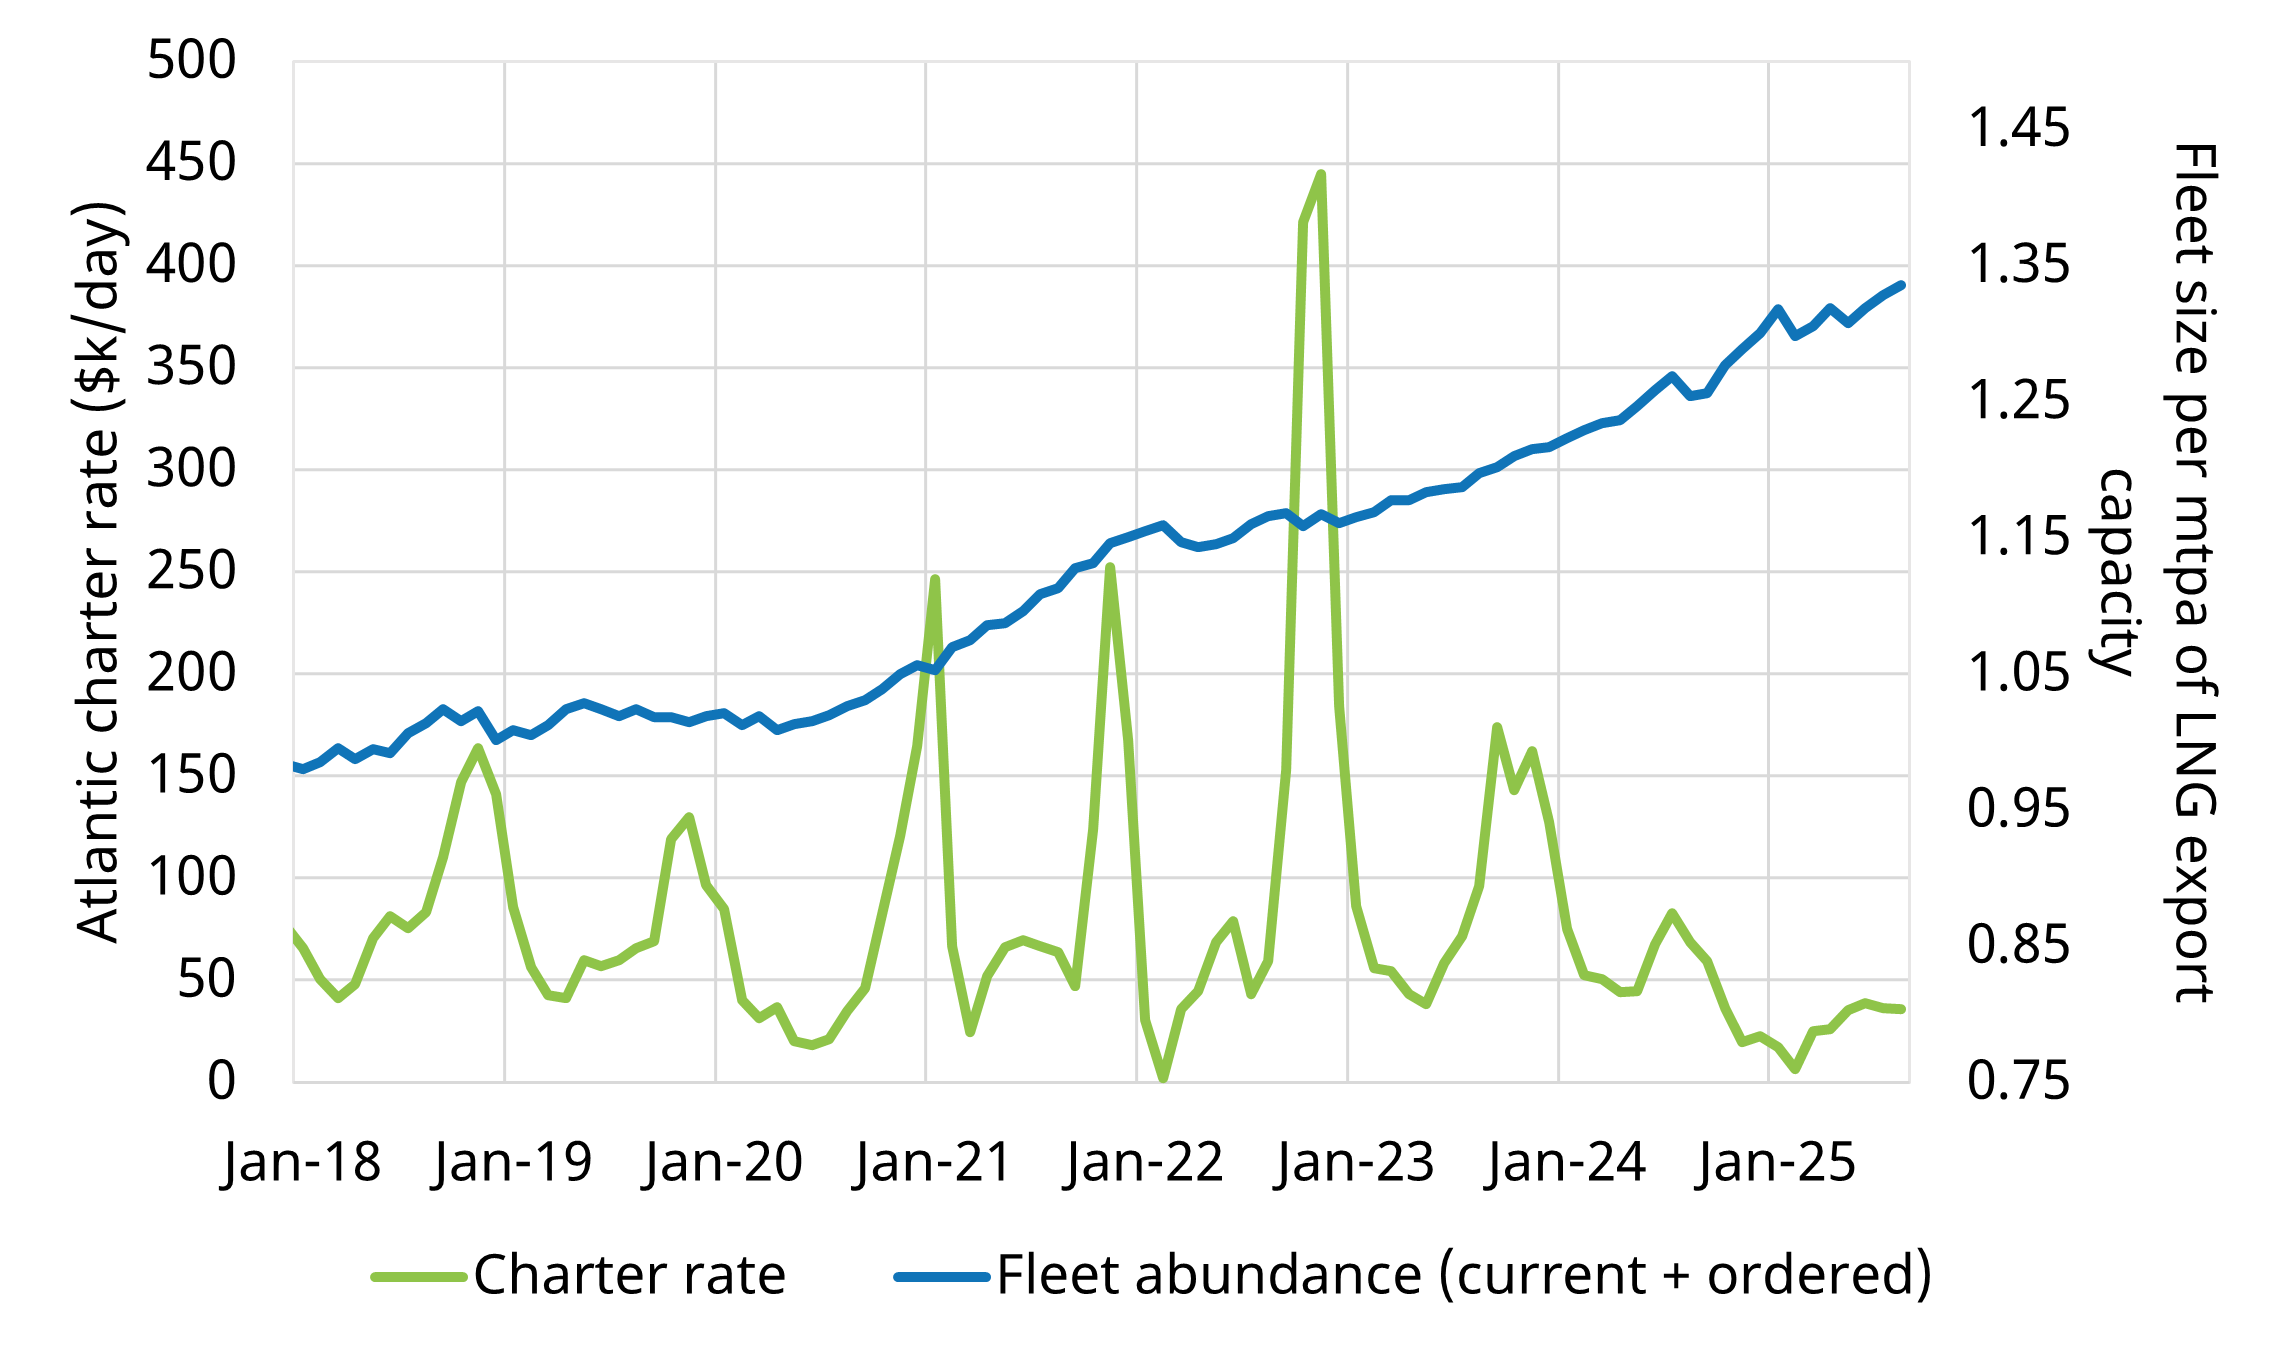
Source: Timera Energy, Spark Commodities, LNG Unlimited
Historically, charter rates follow a structural seasonal pattern, driven by strong winter LNG demand, particularly from Asia, which tightens the shipping market given longer voyages. Seasonality was especially pronounced during the energy-crisis tightness of 2021–23.
Across 2024–25, charter rates have slumped and seasonality has dampened due to:
- New capacity: a large number of new vessels entering the market (e.g. 80–90 in 2025)
- Supply delays: slower ramp-up of new supply projects, so the cargoes expected to absorb new capacity are not yet in place
- Voyage duration: strong post-crisis European LNG demand and weaker Asian demand have shortened average voyage times, freeing up capacity
A simple metric for shipping tightness is “vessels per mtpa of export capacity” i.e. vessel availability. Recently this metric reached an all-time high near ~1.3, putting strong downward pressure on charter rates, which fell as low as $5k/day in Q1.
Fundamental drivers of charter rates
The LNG shipping balance reflects:
- Supply: available shipping capacity (vessel numbers and size)
- Demand: required capacity to move cargoes, a function of LNG market size (cargo count) and voyage duration (how long capacity is tied up)
Chart 2 illustrates shipping supply and demand: an index of the current fleet including orders (a proxy for supply) and required vessel capacity (a proxy for demand).
Chart 2: LNG shipping balance — fleet vs required vessels
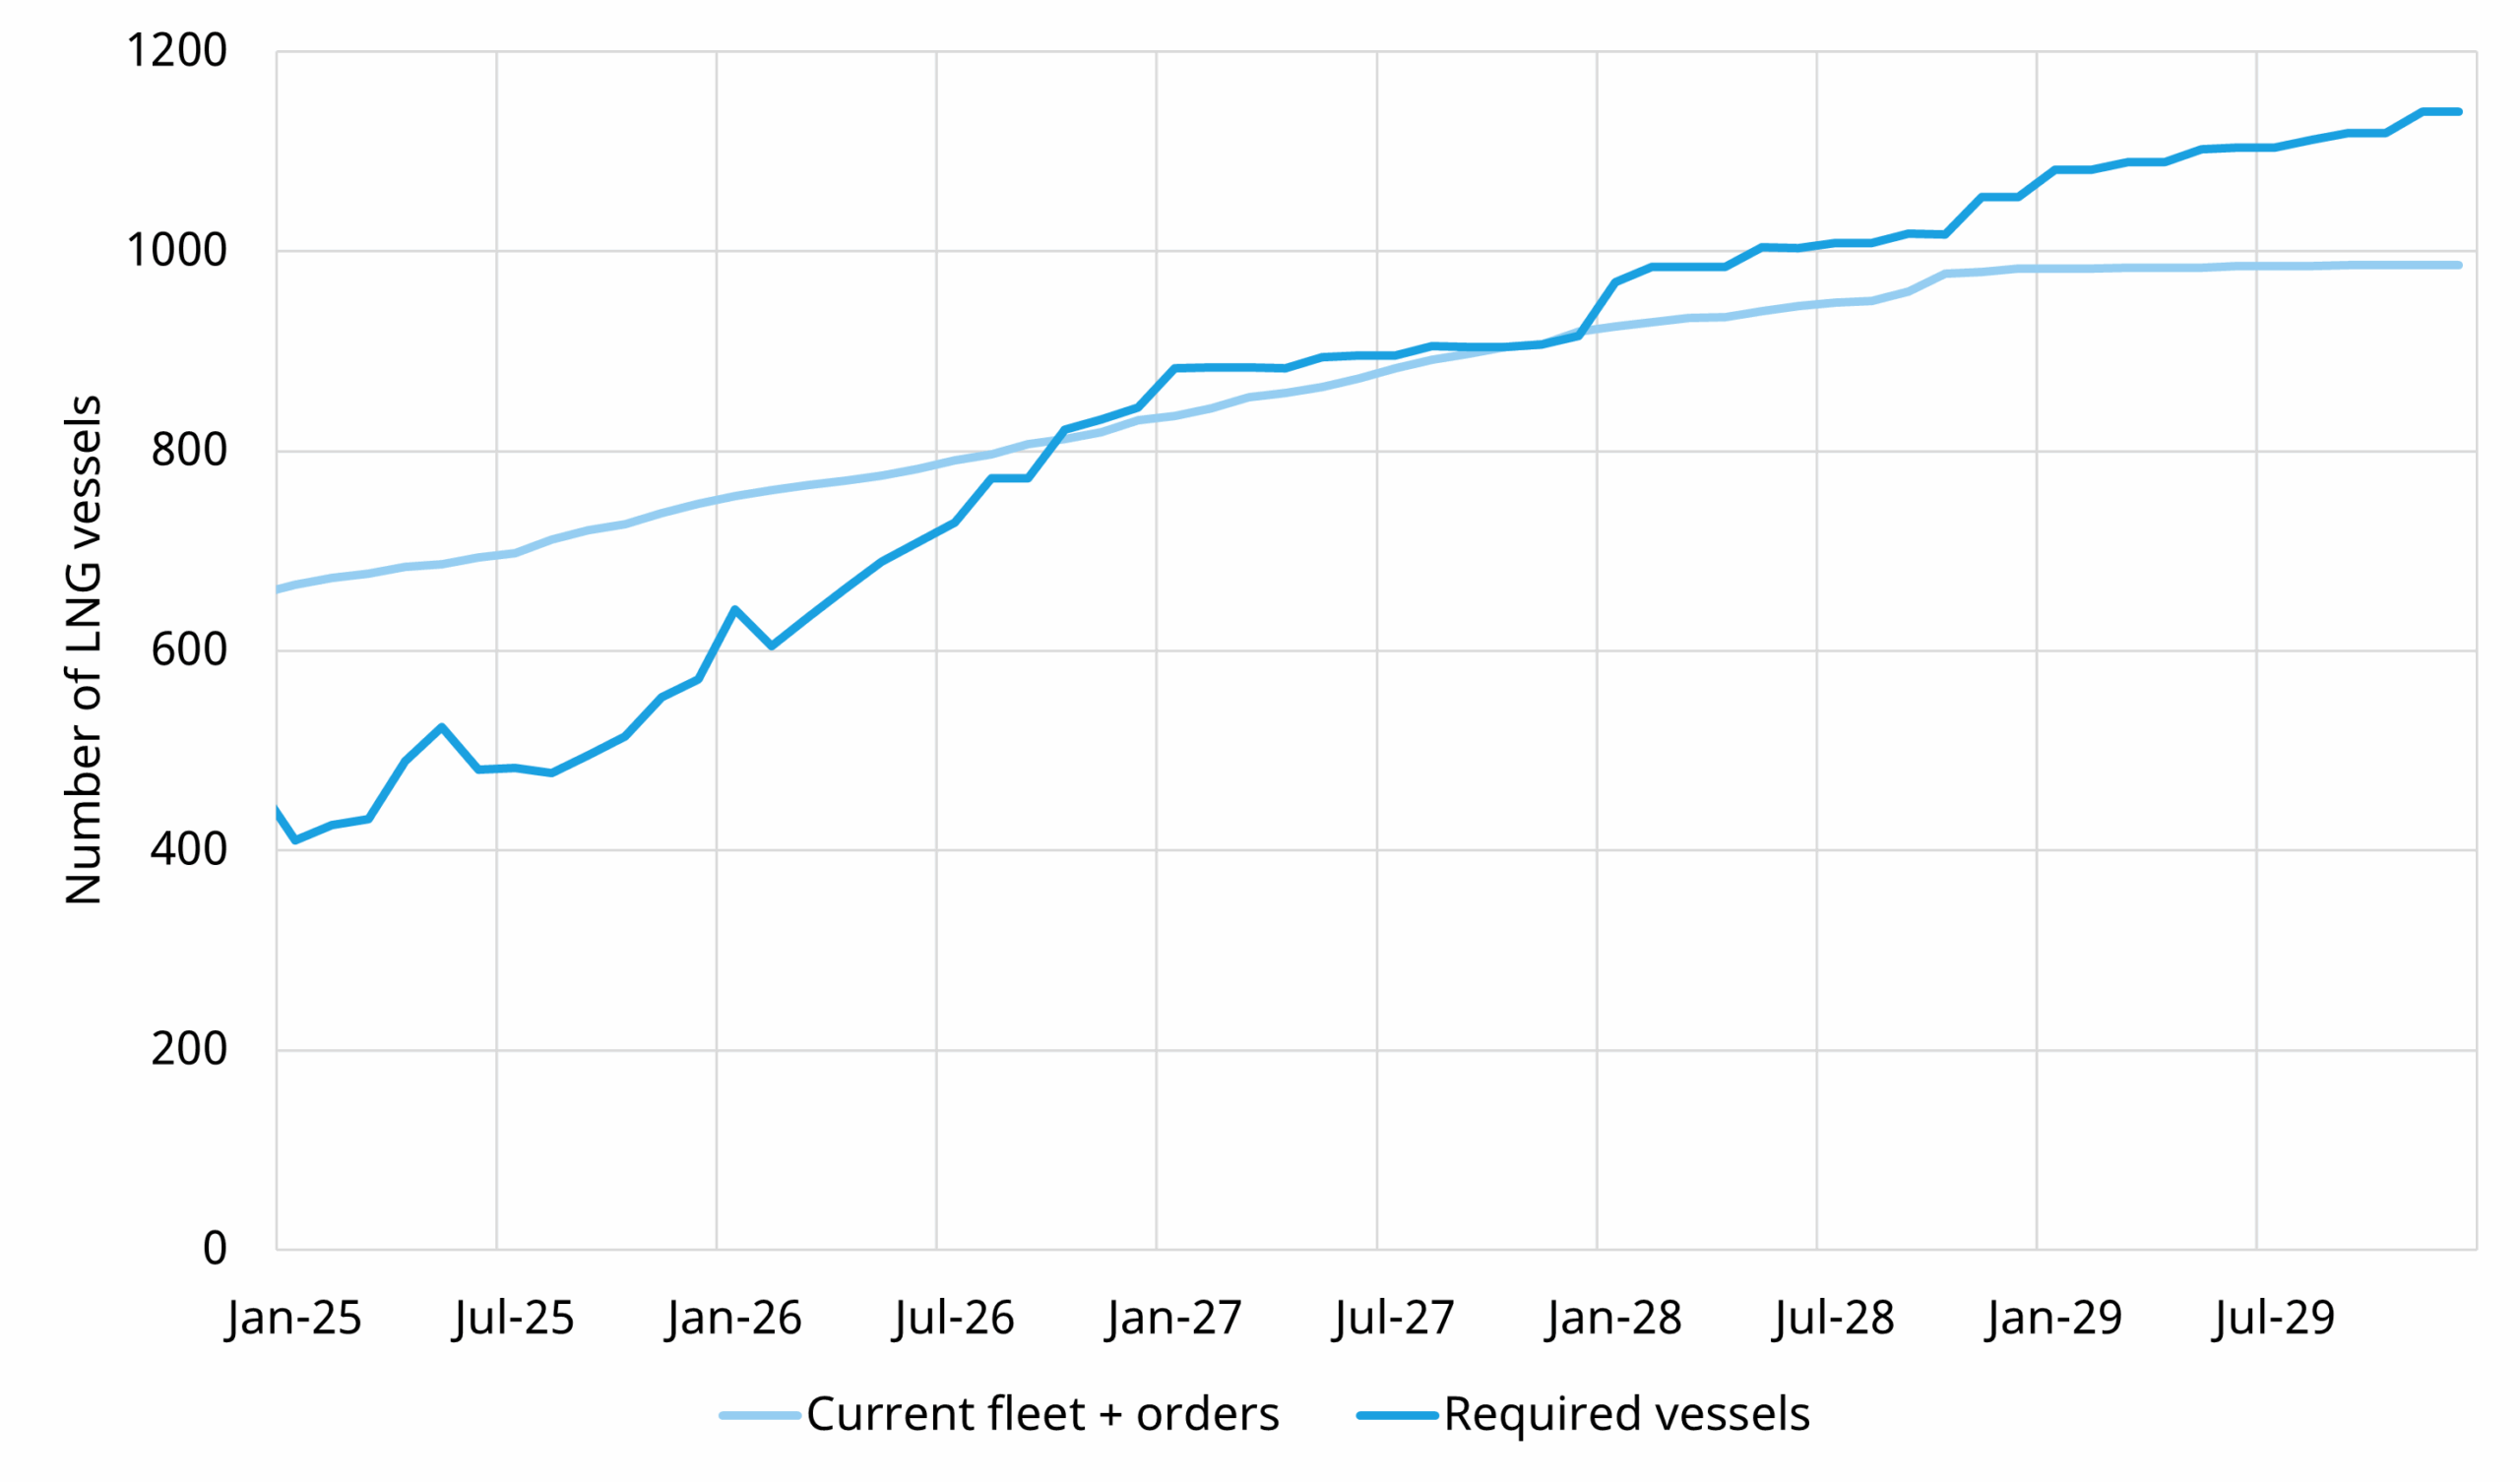
Source: Timera Energy, LNG Unlimited
The chart highlights today’s glut and a projected rebalancing over the next two years as new LNG supply ramps up and absorbs capacity. By the late 2020s the market may tighten again.
Our “required vessels” projection is based on expected vessel tonnage on the water and average voyage duration. We derive LNG flows with our global gas market model, enabling an estimate of the number of vessels needed to service market cargo flows.
Our modelling also projects rising average voyage duration, supporting a tightening shipping market into the late 2020s. A greater share of US Gulf Coast marginal cargoes flows to Asia as the supply wave is absorbed—consistent with longer voyages and wider Asia–Europe price spreads (JKM vs DES NWE).
What does this mean for LNG portfolio value?
A term charter is a large financial commitment, so portfolios often retain some exposure to spot charter rates—either because portfolio strategy doesn’t require the committed tonnage of a term charter, or due to a market view on rates.
Term charters can hedge exposure to charter-rate spikes (e.g. upwards of $100k/day in Chart 1).
To explore the impact, Chart 3 shows margin distributions for a simple portfolio: a US toll, purchasing 12 cargoes per year on a TTF netback basis and selling into TTF. We compare (i) full spot charter exposure (light blue) and (ii) one time-chartered vessel (dark blue).
Both cases are modelled in LNG Bridge with 500 simulations of correlated future market prices and charter rates.
Chart 3: Portfolio margin distributions — spot exposure vs term charter
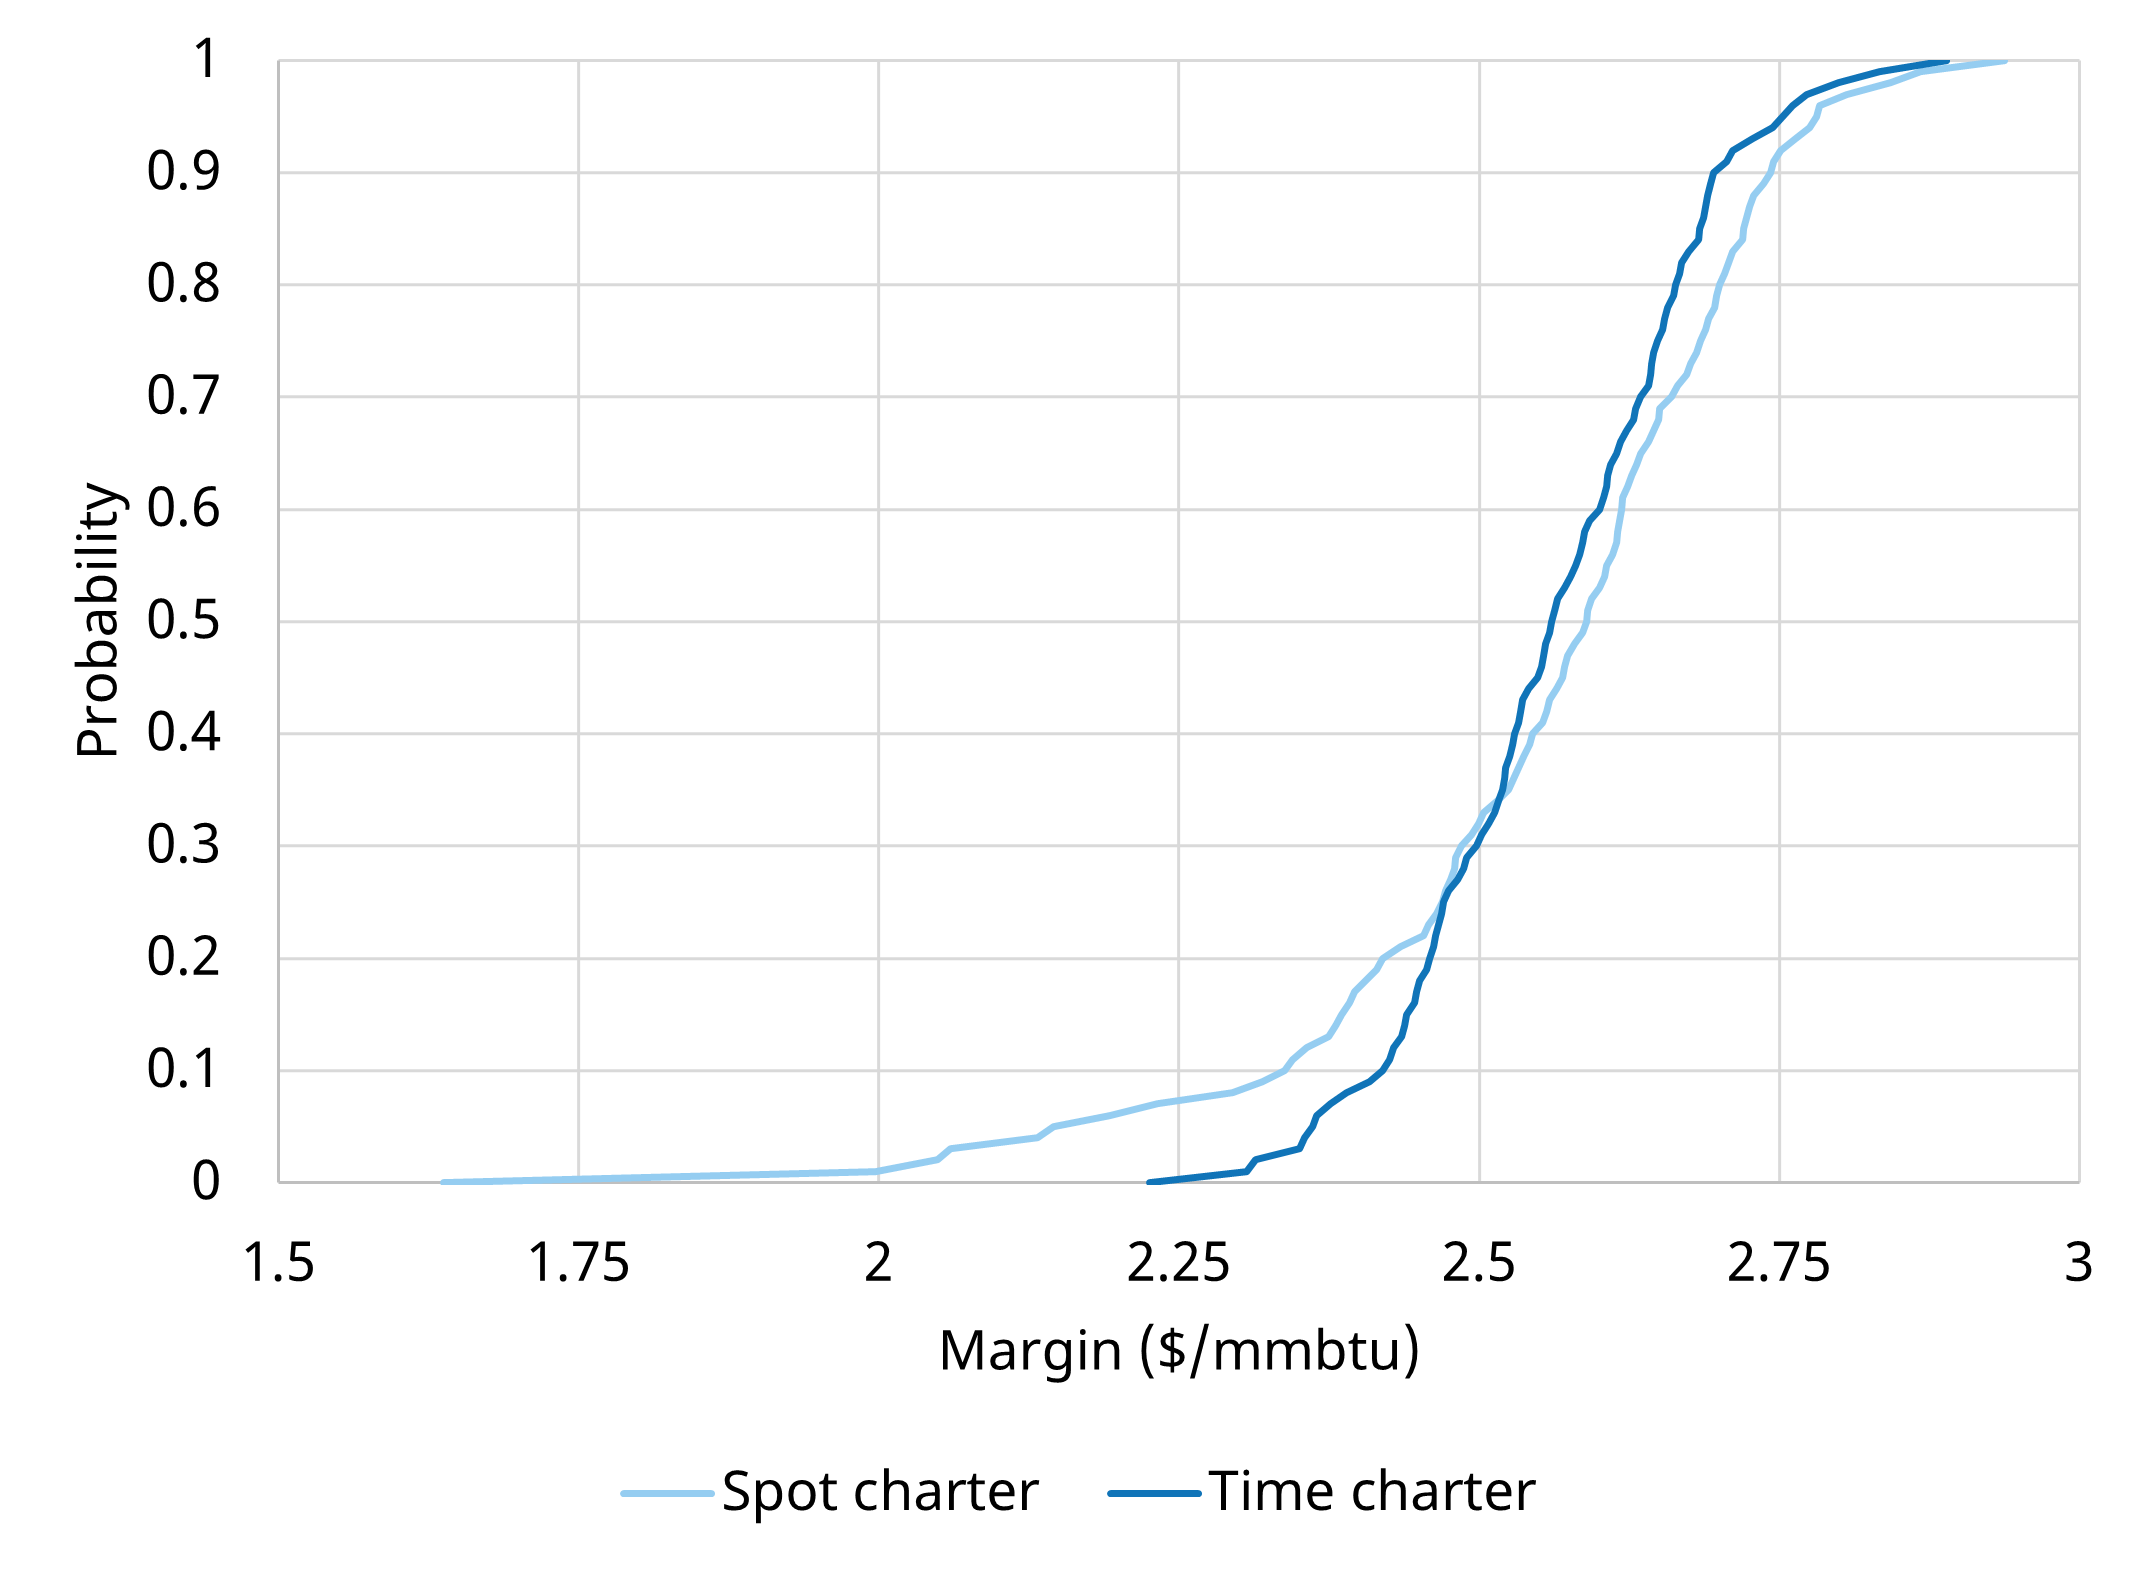
Source: LNG Bridge portfolio valuation model
The first benefit of a time charter is lower margin variance: the time-chartered distribution is much tighter. With a projected tightening in shipping over the next five years (Chart 2), the left-hand tail of the spot case widens (more simulations with higher charter rates), underscoring the second benefit: downside protection.
The decision to fix shipping costs via a term charter isn’t always straightforward – downside protection comes at a cost. Stochastic analysis of shipping exposures can help underpin that decision. For example, the wide left tail for spot exposure may be decisive, particularly if term charters are attractively priced in a weak spot market.
A physical market brings physical risks
Chart 3 illustrates the cost of a term charter: the time-charter case has lower expected value than the spot case, reflecting fixed costs and potential physical inefficiencies from scheduling.
At times, a time-chartered vessel may be unavailable to load a scheduled cargo, forcing engagement in the spot market and increasing costs. This downside is visible in the region above the intersection of the two curves.
For larger portfolios with greater tonnage, detailed management of physical delivery and scheduling is key to minimising losses. Spot exposure at scale introduces risks around vessel availability for loading windows, redelivery, and repositioning that can eat into margins. Multiple time charters can mitigate these risks.
As the LNG market grows and risk management advances, our LNG Bridge model is supporting clients with:
- Investment in new vessels (market outlook, revenue forecast, contract review, technical & policy considerations)
- Shipping strategy (fleet sizing, vessel specifications, etc.)
- LNG portfolio analytics (including shipping exposure and spot freight price volatility)
For more on our fundamental and shipping outlook, or LNG portfolio valuation, contact David Duncan (Director, Gas & LNG) at david.duncan@timera-energy.com.
Join our webinar: “Sailing the supply wave: LNG shipping outlook & portfolio implications ”
Time: 09:00 BST (10:00 CET) Tue 21st Oct
- Spot freight in the doldrums: unpacking today’s low charter rates
- Next supply wave meets Asia growth: how this reshapes vessel demand
- Freight & price spreads: the feedback loop with LNG market value
- Strategic angles: vessel investment and portfolio positioning
- Risks on the horizon: emission & policy developments to watch
Register here