“This is a time to think in probabilities… not absolute outcomes”
The Iranian conflict sparked a major global gas supply shock last week. QatarEnergy fully halted its LNG production & export facilities. LNG & crude oil flows via the Strait of Hormuz have also effectively halted. To put this in context, 81 mtpa (110 bcma) of LNG transited Hormuz in 2025 – just under 20% of global LNG supply.
Between 2021-23, Europe lost around 83 mtpa of Russian pipeline gas. That was a structural loss of supply. Infrastructure was damaged, political relations collapsed, and markets repriced for the reality that supply was not coming back. JKM & TTF prices surged to almost 100 $/mmbtu.
In today’s article, we set out:
- Why ‘this time is different’
- A framework for navigating significant uncertainty & volatility
- 5 key drivers set to shape market impact.
This time is different.
Why? The market is so far pricing the Qatari and Hormuz disruption as temporary, not structural. Infrastructure so far remains intact. Cargo flows can in principle restart quickly.
Supply disruption is also happening during a period of substantial global LNG supply growth, we expect around 40 mt of supply growth ex-Middle East in 2026 (vs an average of ~ 9 mtpa across 2021-24 when Russian losses were occurring).
Forward prices reflect this as shown in Chart 1. Price impact is focused on 2026, with limited impact beyond the coming winter. The market is pricing near term disruption impact and a heightened risk premium, not a structural shift in market balance… at least so far.
Chart 1: TTF forward price curve impact
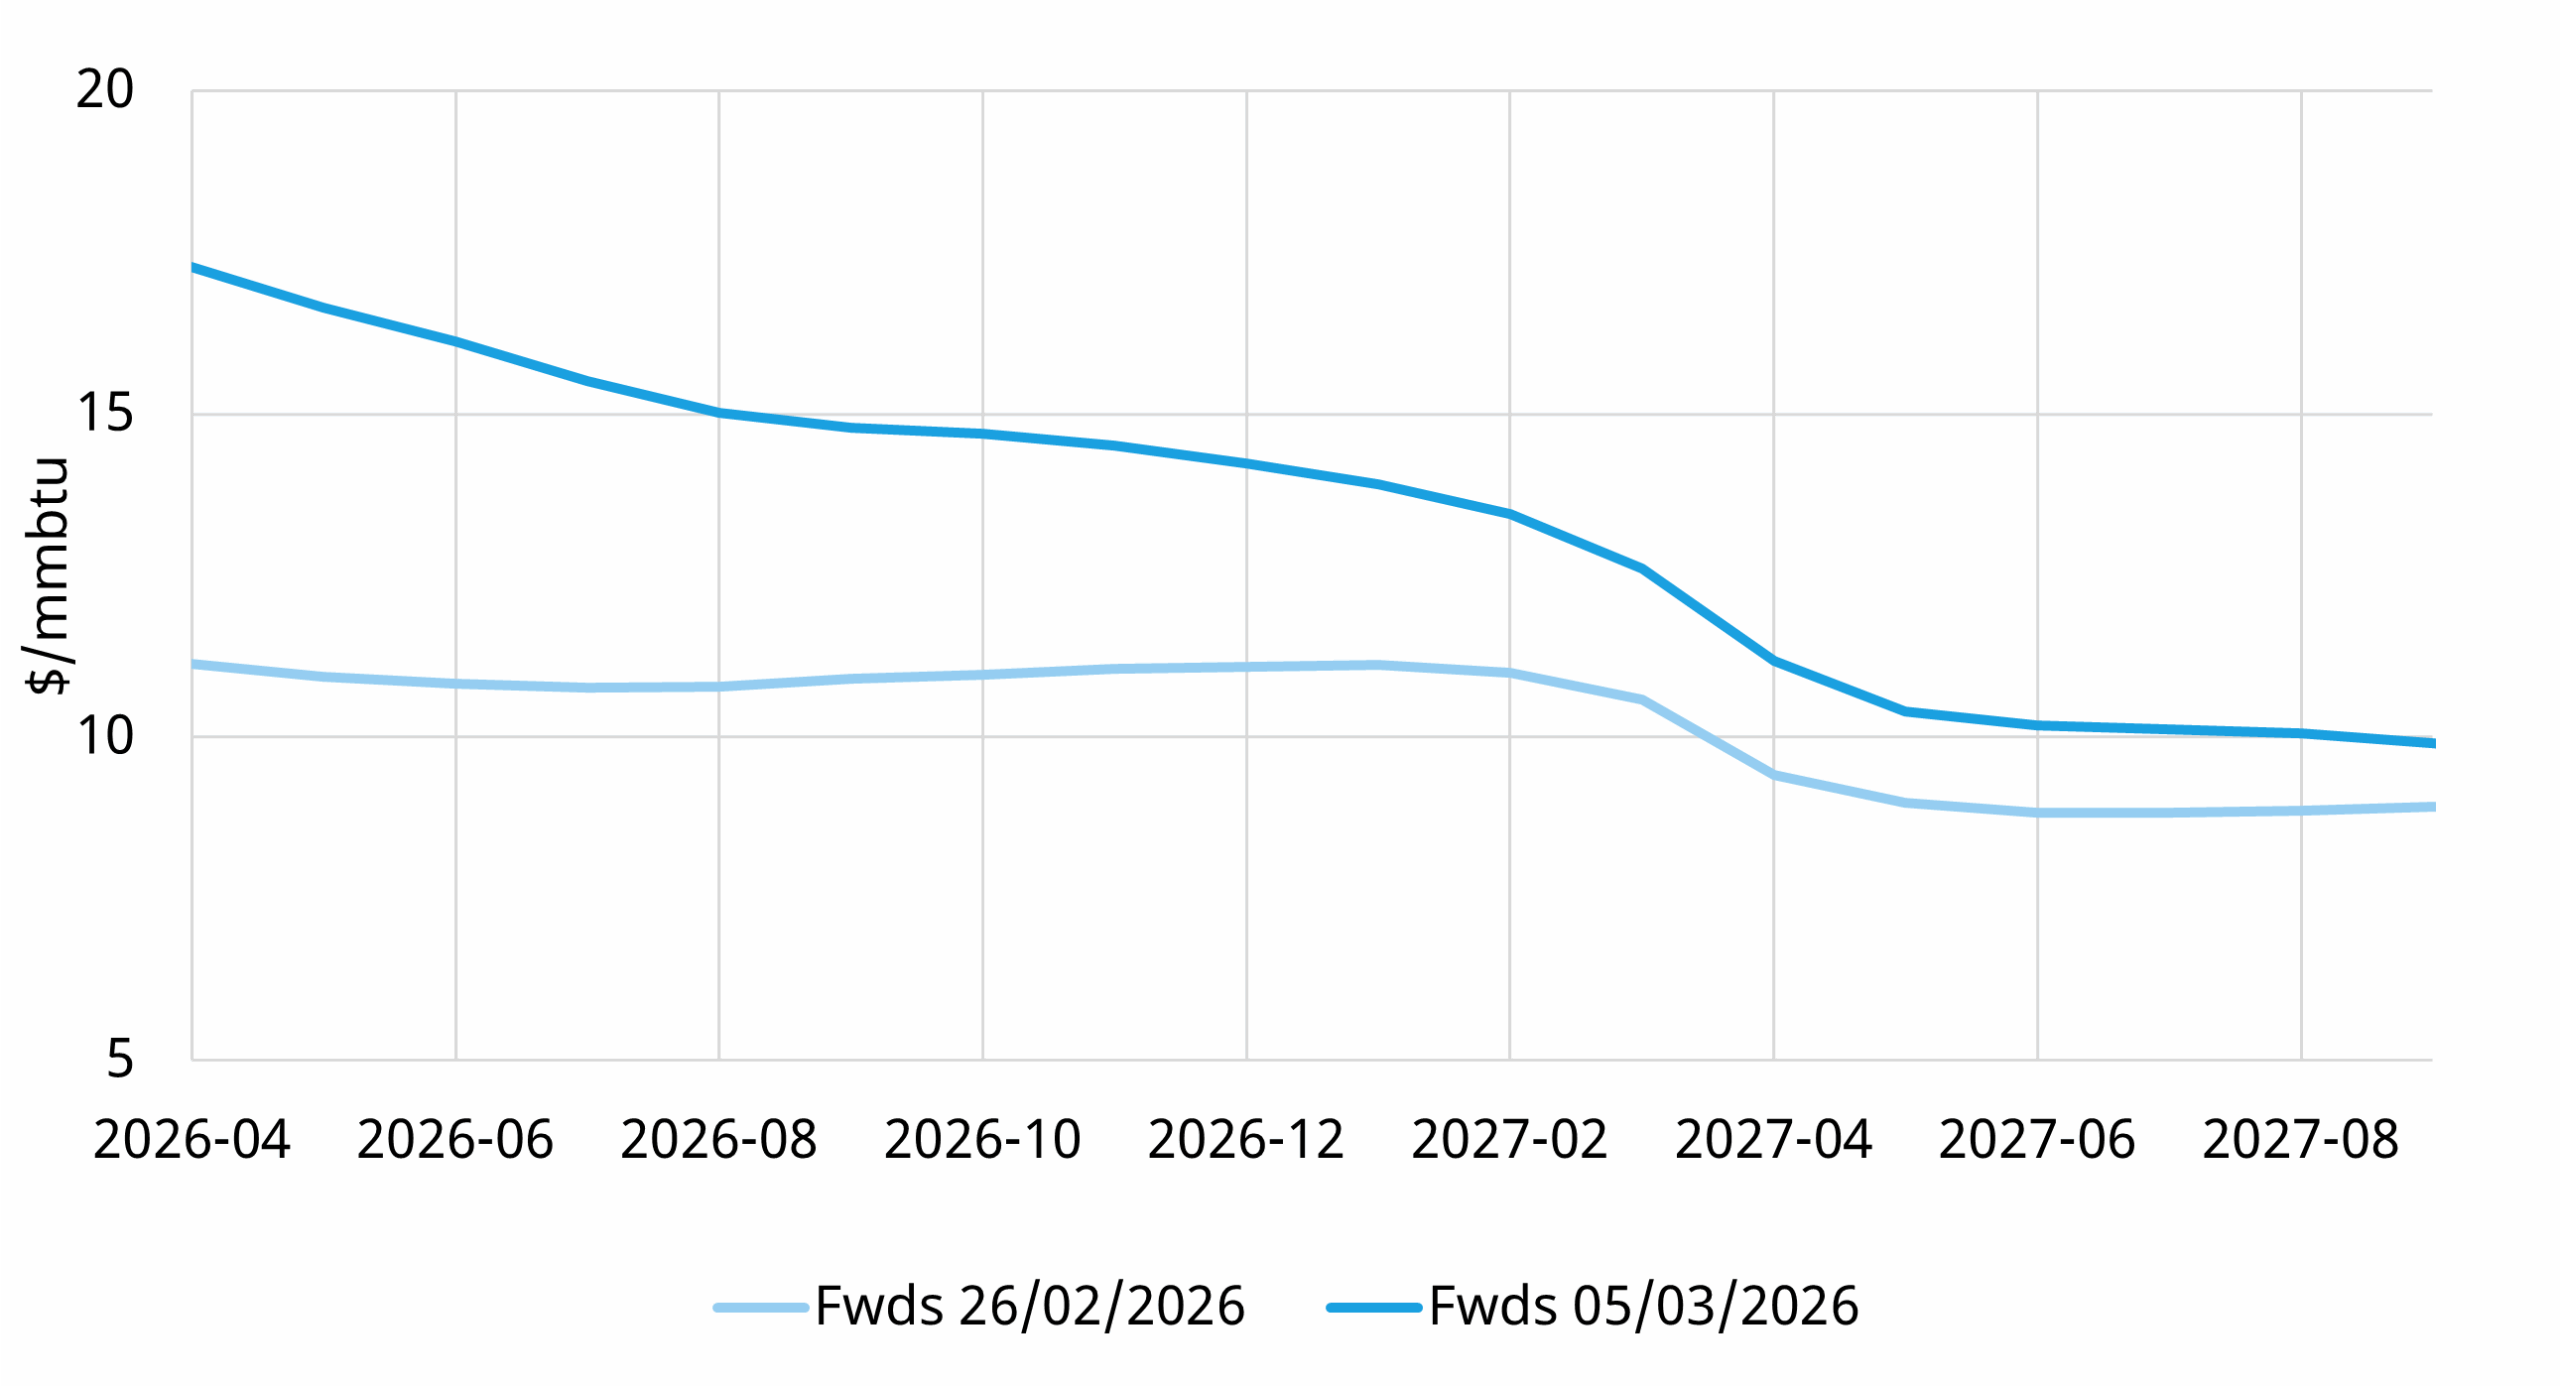
Source: ICE
The supply shock is set to drive significant near-term price volatility. Europe and Asia will compete at the margin for available cargoes, with major rerouting of flows.
Watch the back end of the JKM and TTF curves. As long as these remain anchored, the market is treating this as a temporary shock.
If 2027–2028 starts repricing materially higher, then markets are beginning to treat disruption risk as something more structural.
Framing the LNG supply & demand impact
The geo-political situation in the Middle East is fluid, creating substantial uncertainty as to the length and scale of energy supply disruption. This is a time to think in probabilities, not absolutes.
The most robust way to quantify the market impact of different potential outcomes is to analyse the impact on LNG market supply & demand balance and marginal pricing.
In Chart 2, we illustrate two scenarios for Summer 2026 (Apr – Sep) LNG market supply & demand balance using our Global Gas Market Model:
- ‘Pre Crisis Baseline’ – minimal supply disruption
- ‘Three Month Loss’ – three full months of Qatari LNG supply loss given ‘shut-in’ production.
Chart 2: LNG market impact of 3 month loss of Qatari supply (Summer 2026)
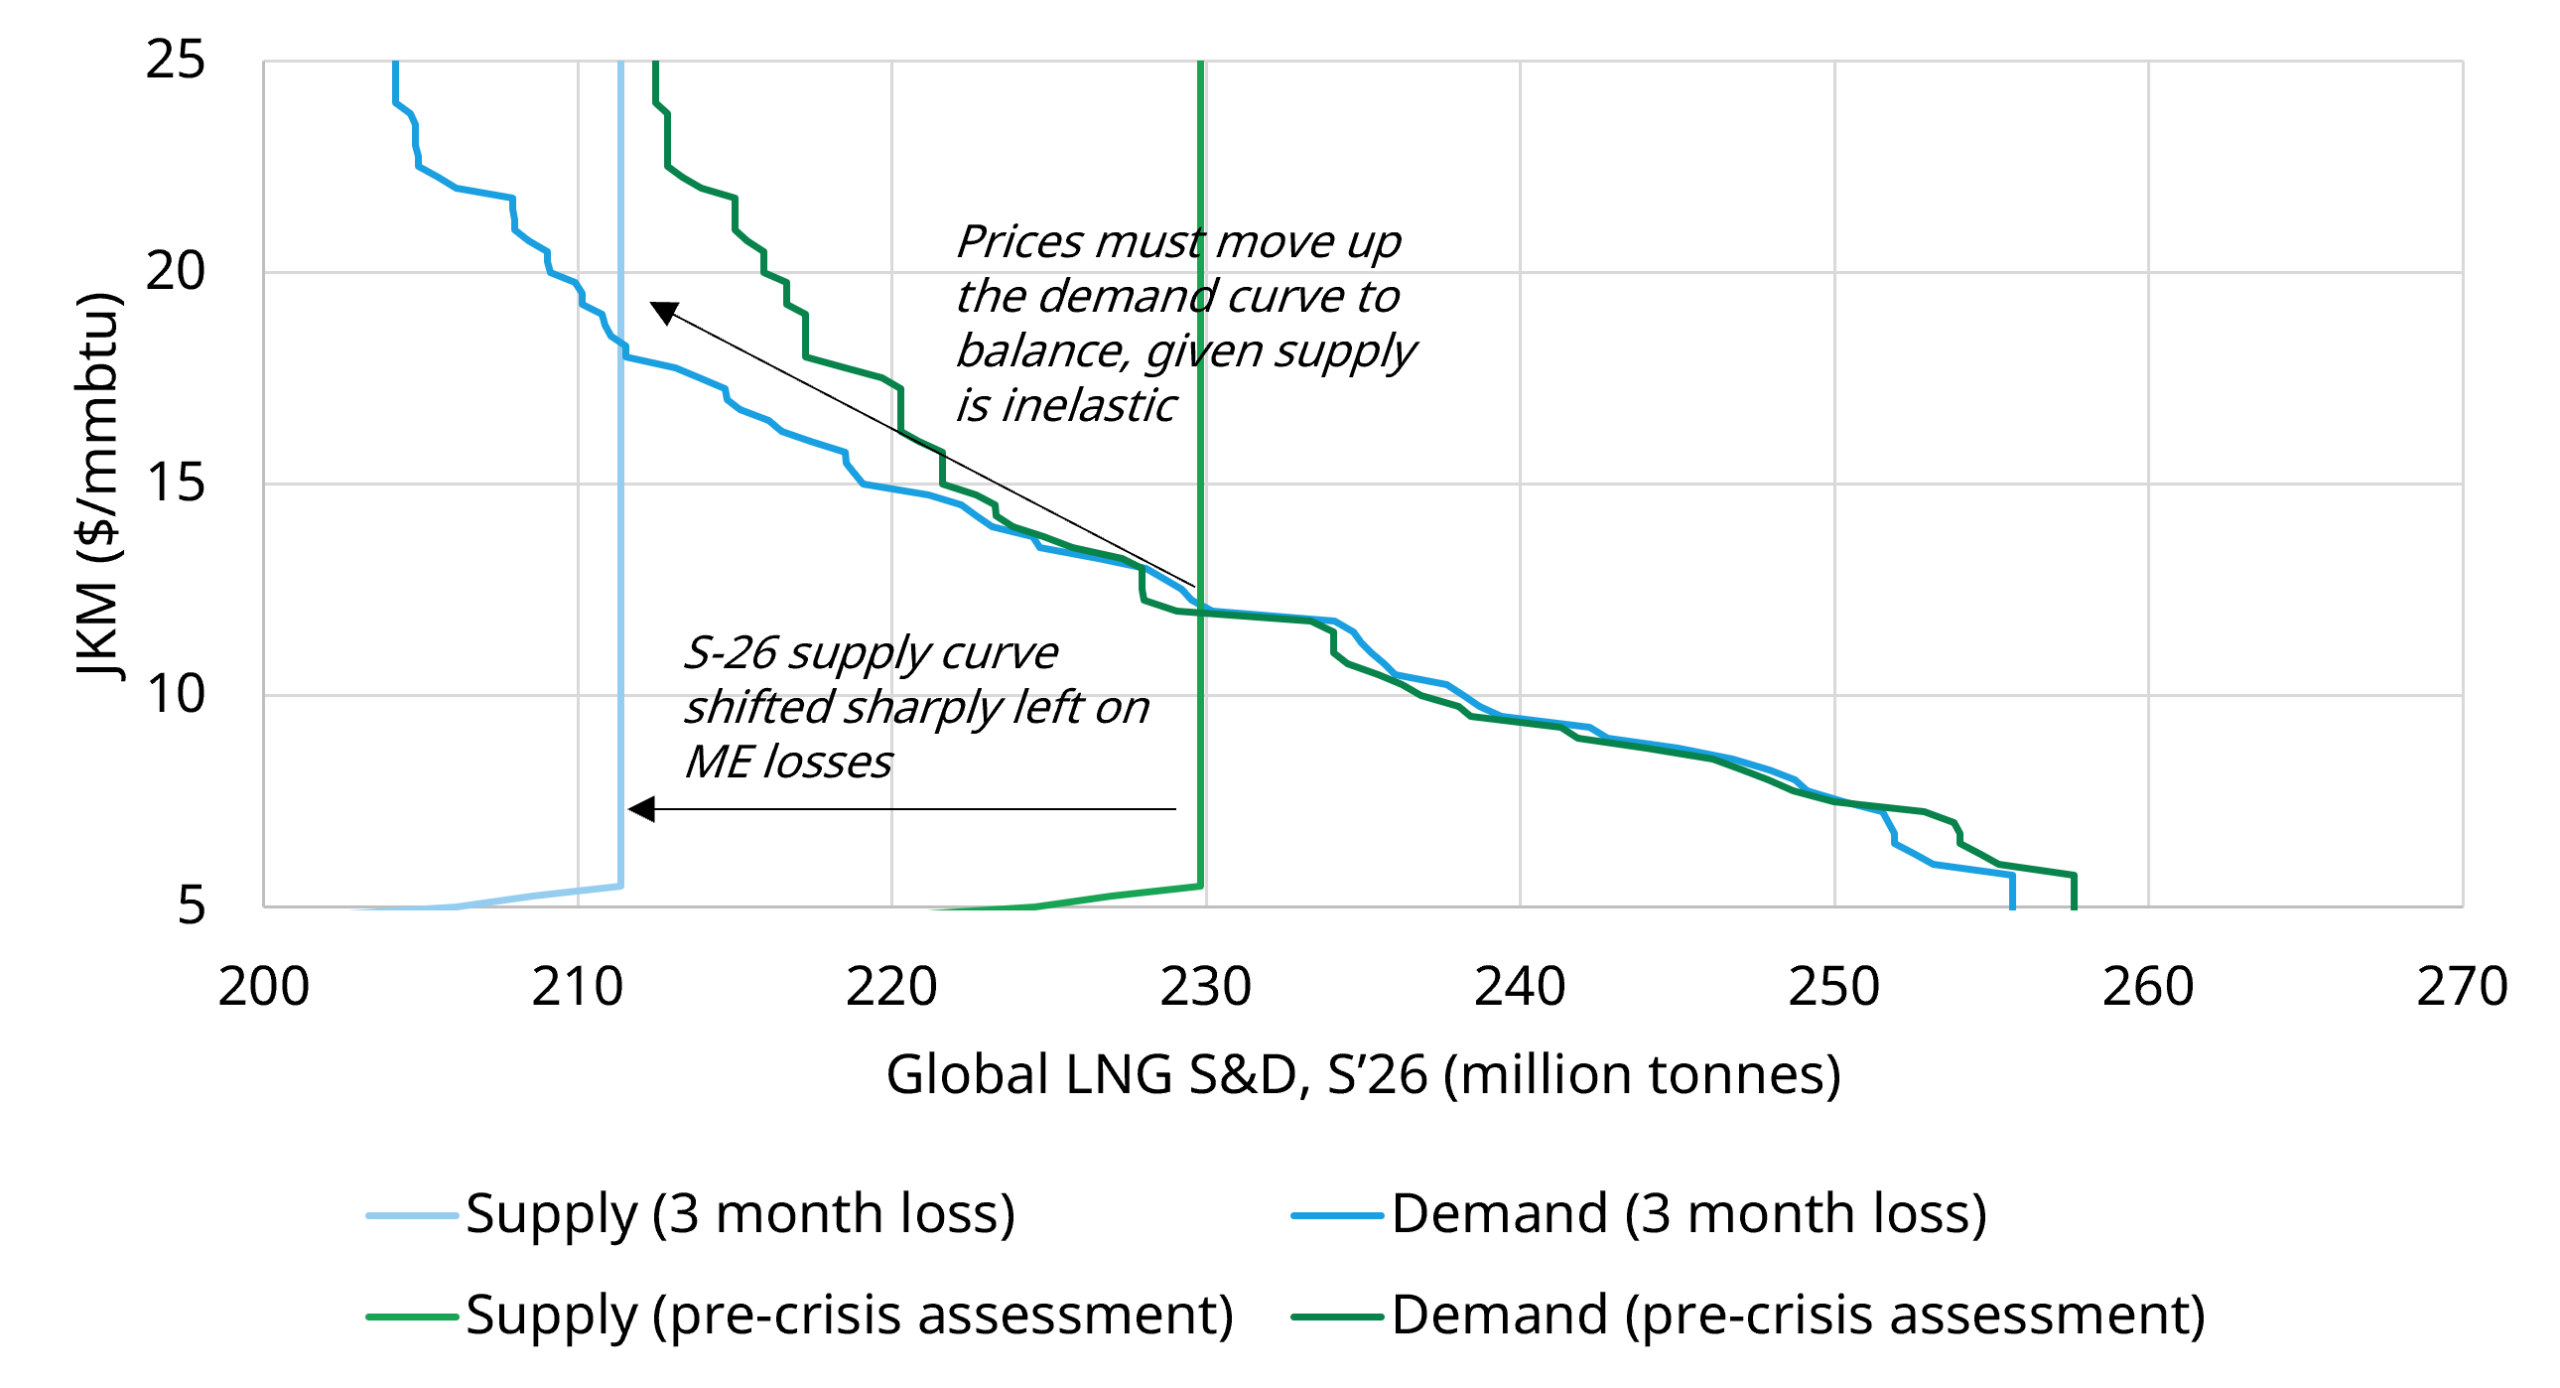
Source: Timera Global Gas Model; note this chart is a simplified 6 month horizon snapshot of a range of more detailed stochastic model outputs.
Qatari production cuts shift the global supply curve to the left (green curve to blue curve in the chart), resulting in higher marginal clearing prices.
The supply shock also impacts the LNG market demand curve. Higher Brent prices act to lift the demand curve (via oil-indexed switching in Asia). Front month Brent prices have now spiked above 100 $/bbl on fears of infrastructure damage and more prolonged crude supply impact – volatile Brent prices have a dynamic impact on LNG demand.
The LNG demand curve in Chart 2 also widens given an increase in Asian demand response as buyers lose contracted Qatari supply and are exposed to spot prices. This is important because it dampens the impact of the supply shock on LNG prices – but drivers here are a bit more nuanced, so we come back to it in the next section.
The key uncertainty facing the LNG market is the duration of the supply shock. This includes the length of Qatari production cuts and of shipping restrictions through Hormuz. It also includes any further infrastructure damage to LNG & crude export capabilities.
What is clear from the S&D curves is that the primary mechanism that will determine how the LNG market clears – and at what price – is demand response dynamics.
Asian demand response key to clearing the LNG market
Prior to this supply shock, the market expected around 26 mt of additional LNG supply to come online by this summer (vs summer 2025). Forward prices reflected this with backwardation across 2026 and 2027.
The LNG market now faces the loss of around 7 mt of Middle Eastern LNG supply for every month the crisis continues. This risk has pushed near term prices more than 50% higher in order to catalyse a sufficient demand side response to rebalance the market.
How responsive will demand be to higher prices? To assess this, we need to quantify the impact of the Qatari supply shock on Asia’s LNG demand curve.
We show two LNG demand curves from our Global Gas Model in Chart 3. These correspond to the Pre-Crisis Baseline and 3 Month Loss cases shown in Chart 2.
Chart 3: Impact of three month supply shock on Asian LNG demand curve (Summer 2026)
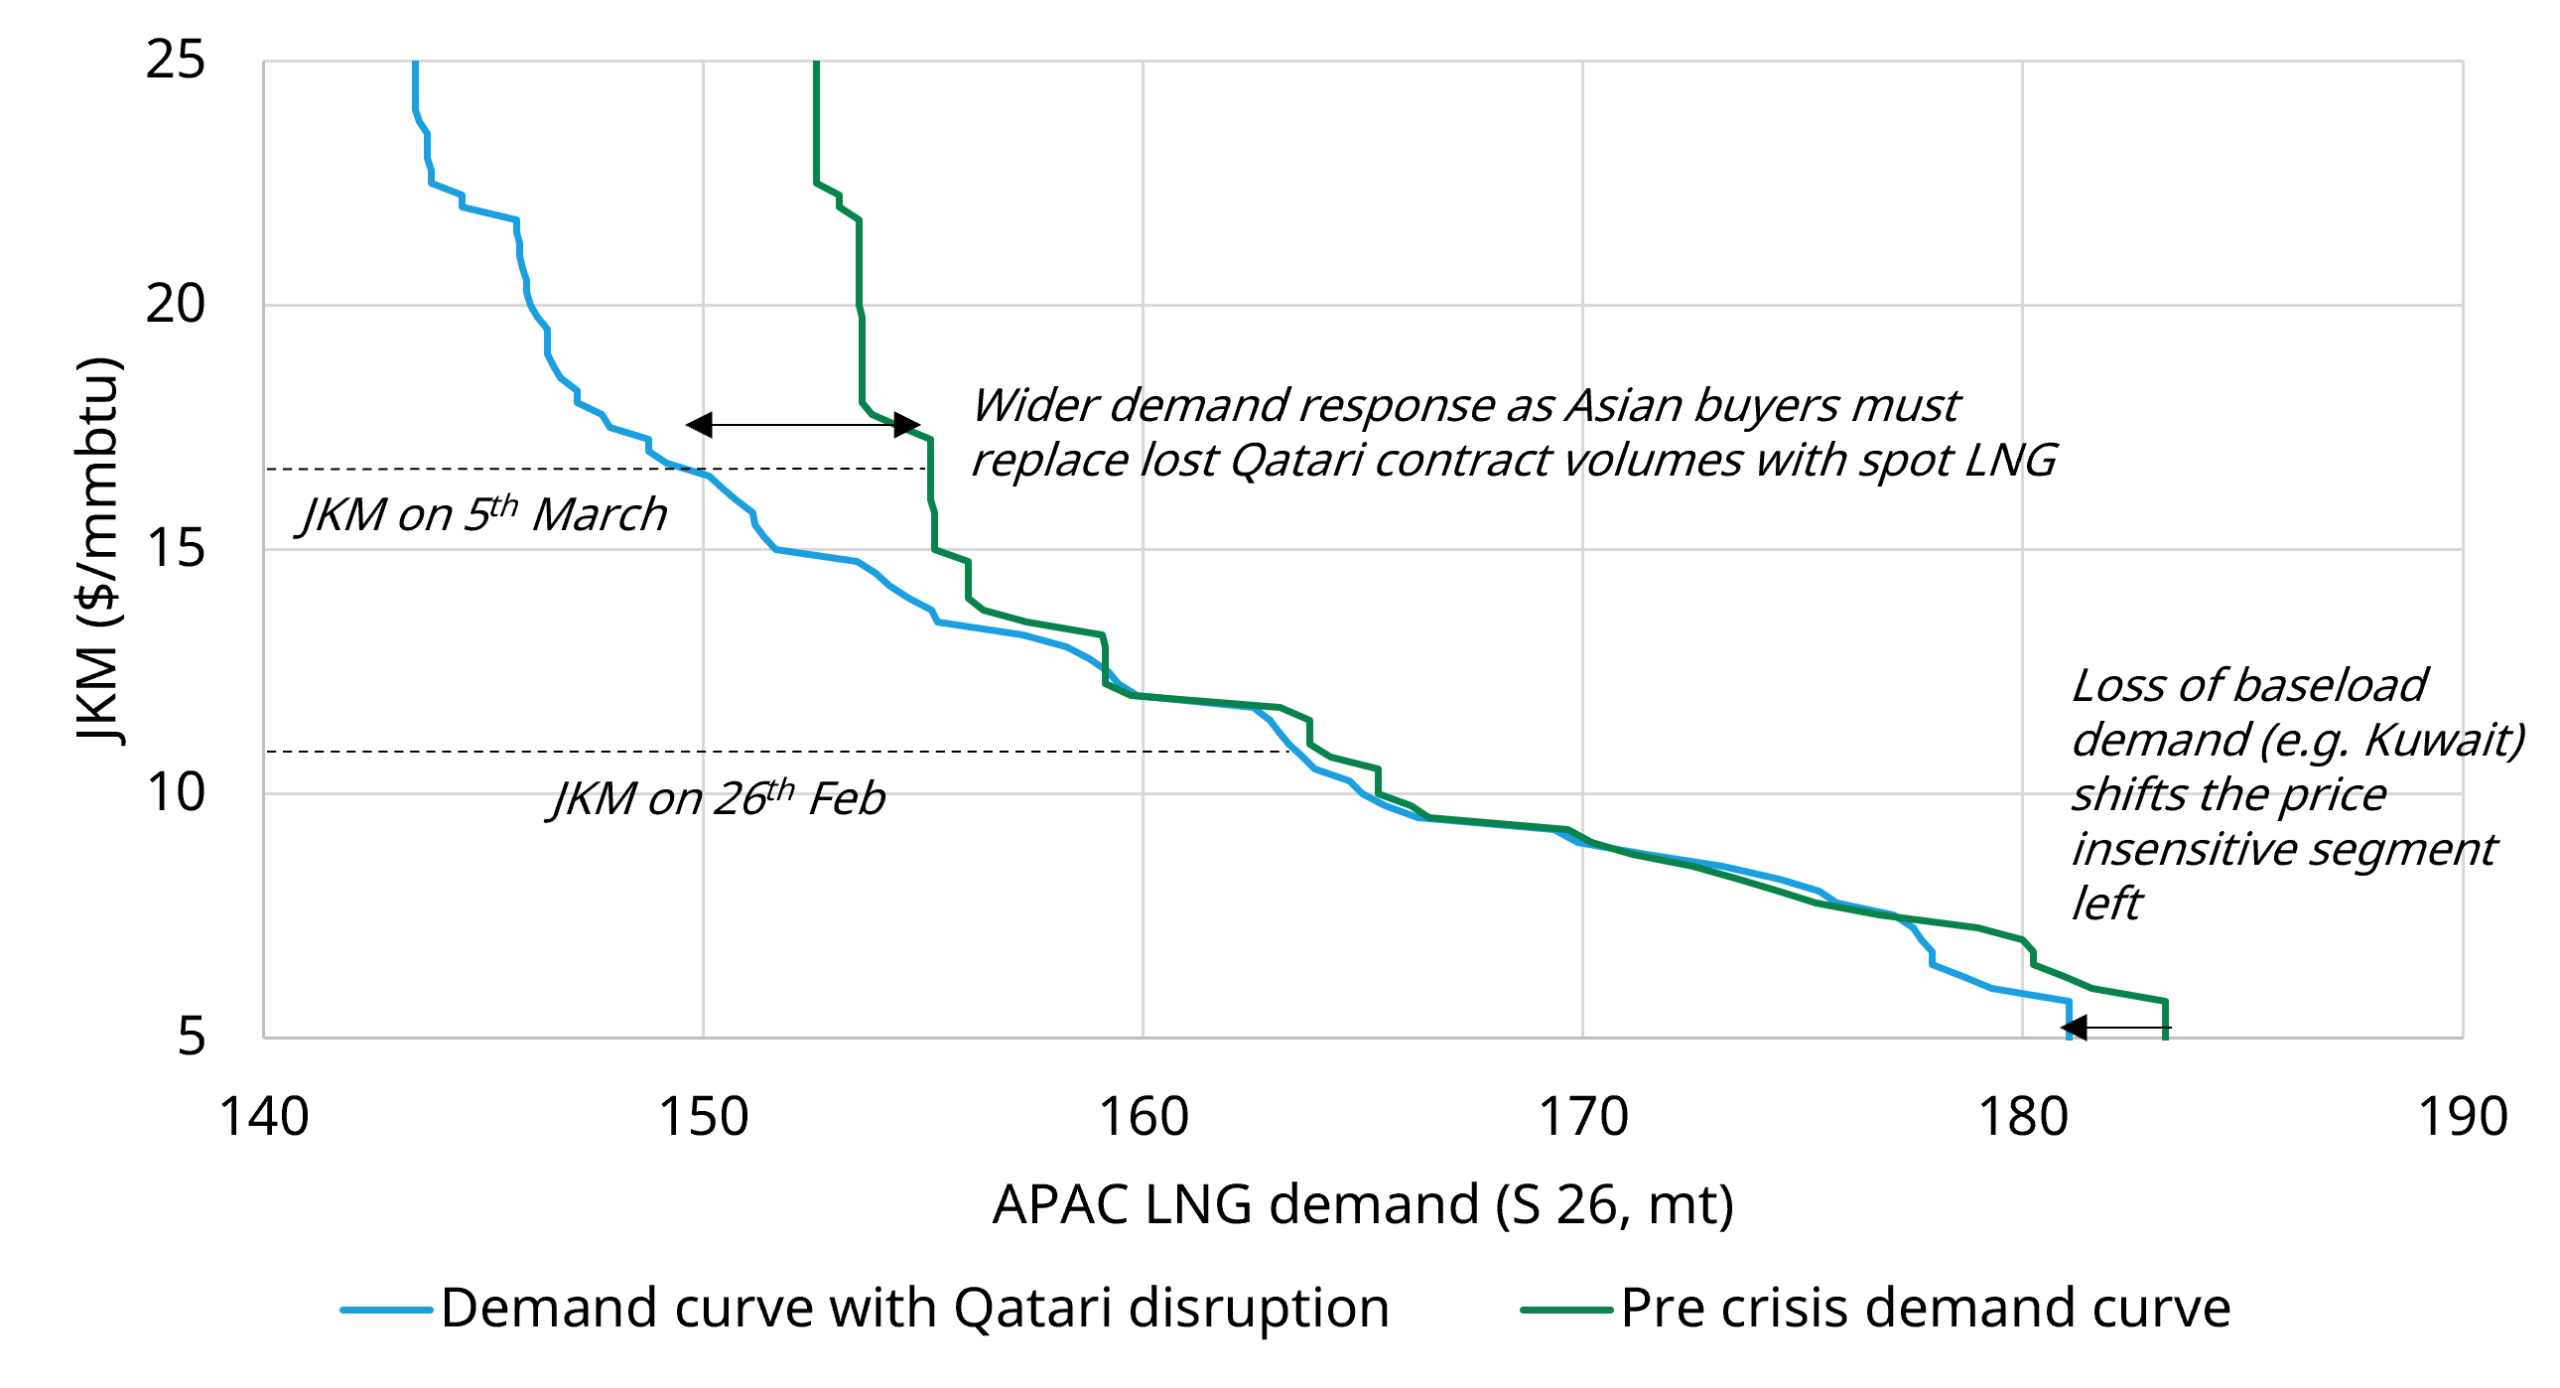
Source: Timera Global Gas Model
Summer 2026 JKM prices have moved from around 11 $/mmbtu on 26 February to 17 $/mmbtu on 6 March.
The green Pre-Crisis demand curve in Chart 3 shows that a price move of this magnitude would drive around 7 to 8 mt of demand losses across Summer 2026, primarily through oil to gas switching, as well as some outright demand destruction.
However, demand response in Asia is directly impacted by the non-delivery of long term contracted Qatari supply to Asian buyers (particularly in South Asia). These buyers need to make up lost Qatari volumes in the spot market at much higher price levels.
The impact of Qatari cancellations is to make Asian LNG demand significantly more price responsive (or elastic). This is illustrated by the widening of the demand curve from the Pre-Crisis case (green) to 3 Month Loss case (blue) in Chart 3.
What is important to understand is that this increase in Asian demand elasticity (responsiveness) acts to dampen the price increase required to rebalance the market.
Put simply, greater exposure to spot prices increases the demand responsiveness of Asian buyers, reducing the upward pressure on LNG prices. In this way, the Qatari supply shock creates a feedback loop via demand response that helps to mitigate its price impact.
There will also likely be some policy driven reductions in LNG demand in parts of Asia as governments seek to maximise coal and oil burn in response to the shock. Further baseload demand is also lost within the Middle East itself, as Kuwaiti LNG imports are disrupted during the crisis, shifting the demand curve further to the left.
European storage can extend the price shock
In contrast to Asia, the European gas demand curve is not materially altered by the Qatari supply disruption. This reflects the already high level of spot price exposure across European downstream demand and a lower dependence on long term contracted Qatari LNG supply.
Our modelling estimates around a 6 mt reduction in European downstream demand across Summer 2026 from the roughly 5 $ / mmbtu rise in Summer 26 TTF prices since the shock.
This response is driven by incremental coal to gas switching and some industrial demand reduction. Industrial demand response is likely to be more lagged, given the impact of hedging across many industrial consumers.
While our modeling shows European downstream demand response is more muted than in Asia, it shows European storage playing a key role in determining the overall price impact. Storage provides an important balancing lever, with price backwardation reducing the pace of injections during Summer 2026 and delaying when gas is placed into storage.
This dynamic is illustrated in Chart 4, which shows how our Global Gas Model balances the LNG market under the 3 Month Loss case (relative to Pre-Crisis Baseline).
Chart 4: How a three month LNG supply shock is balanced
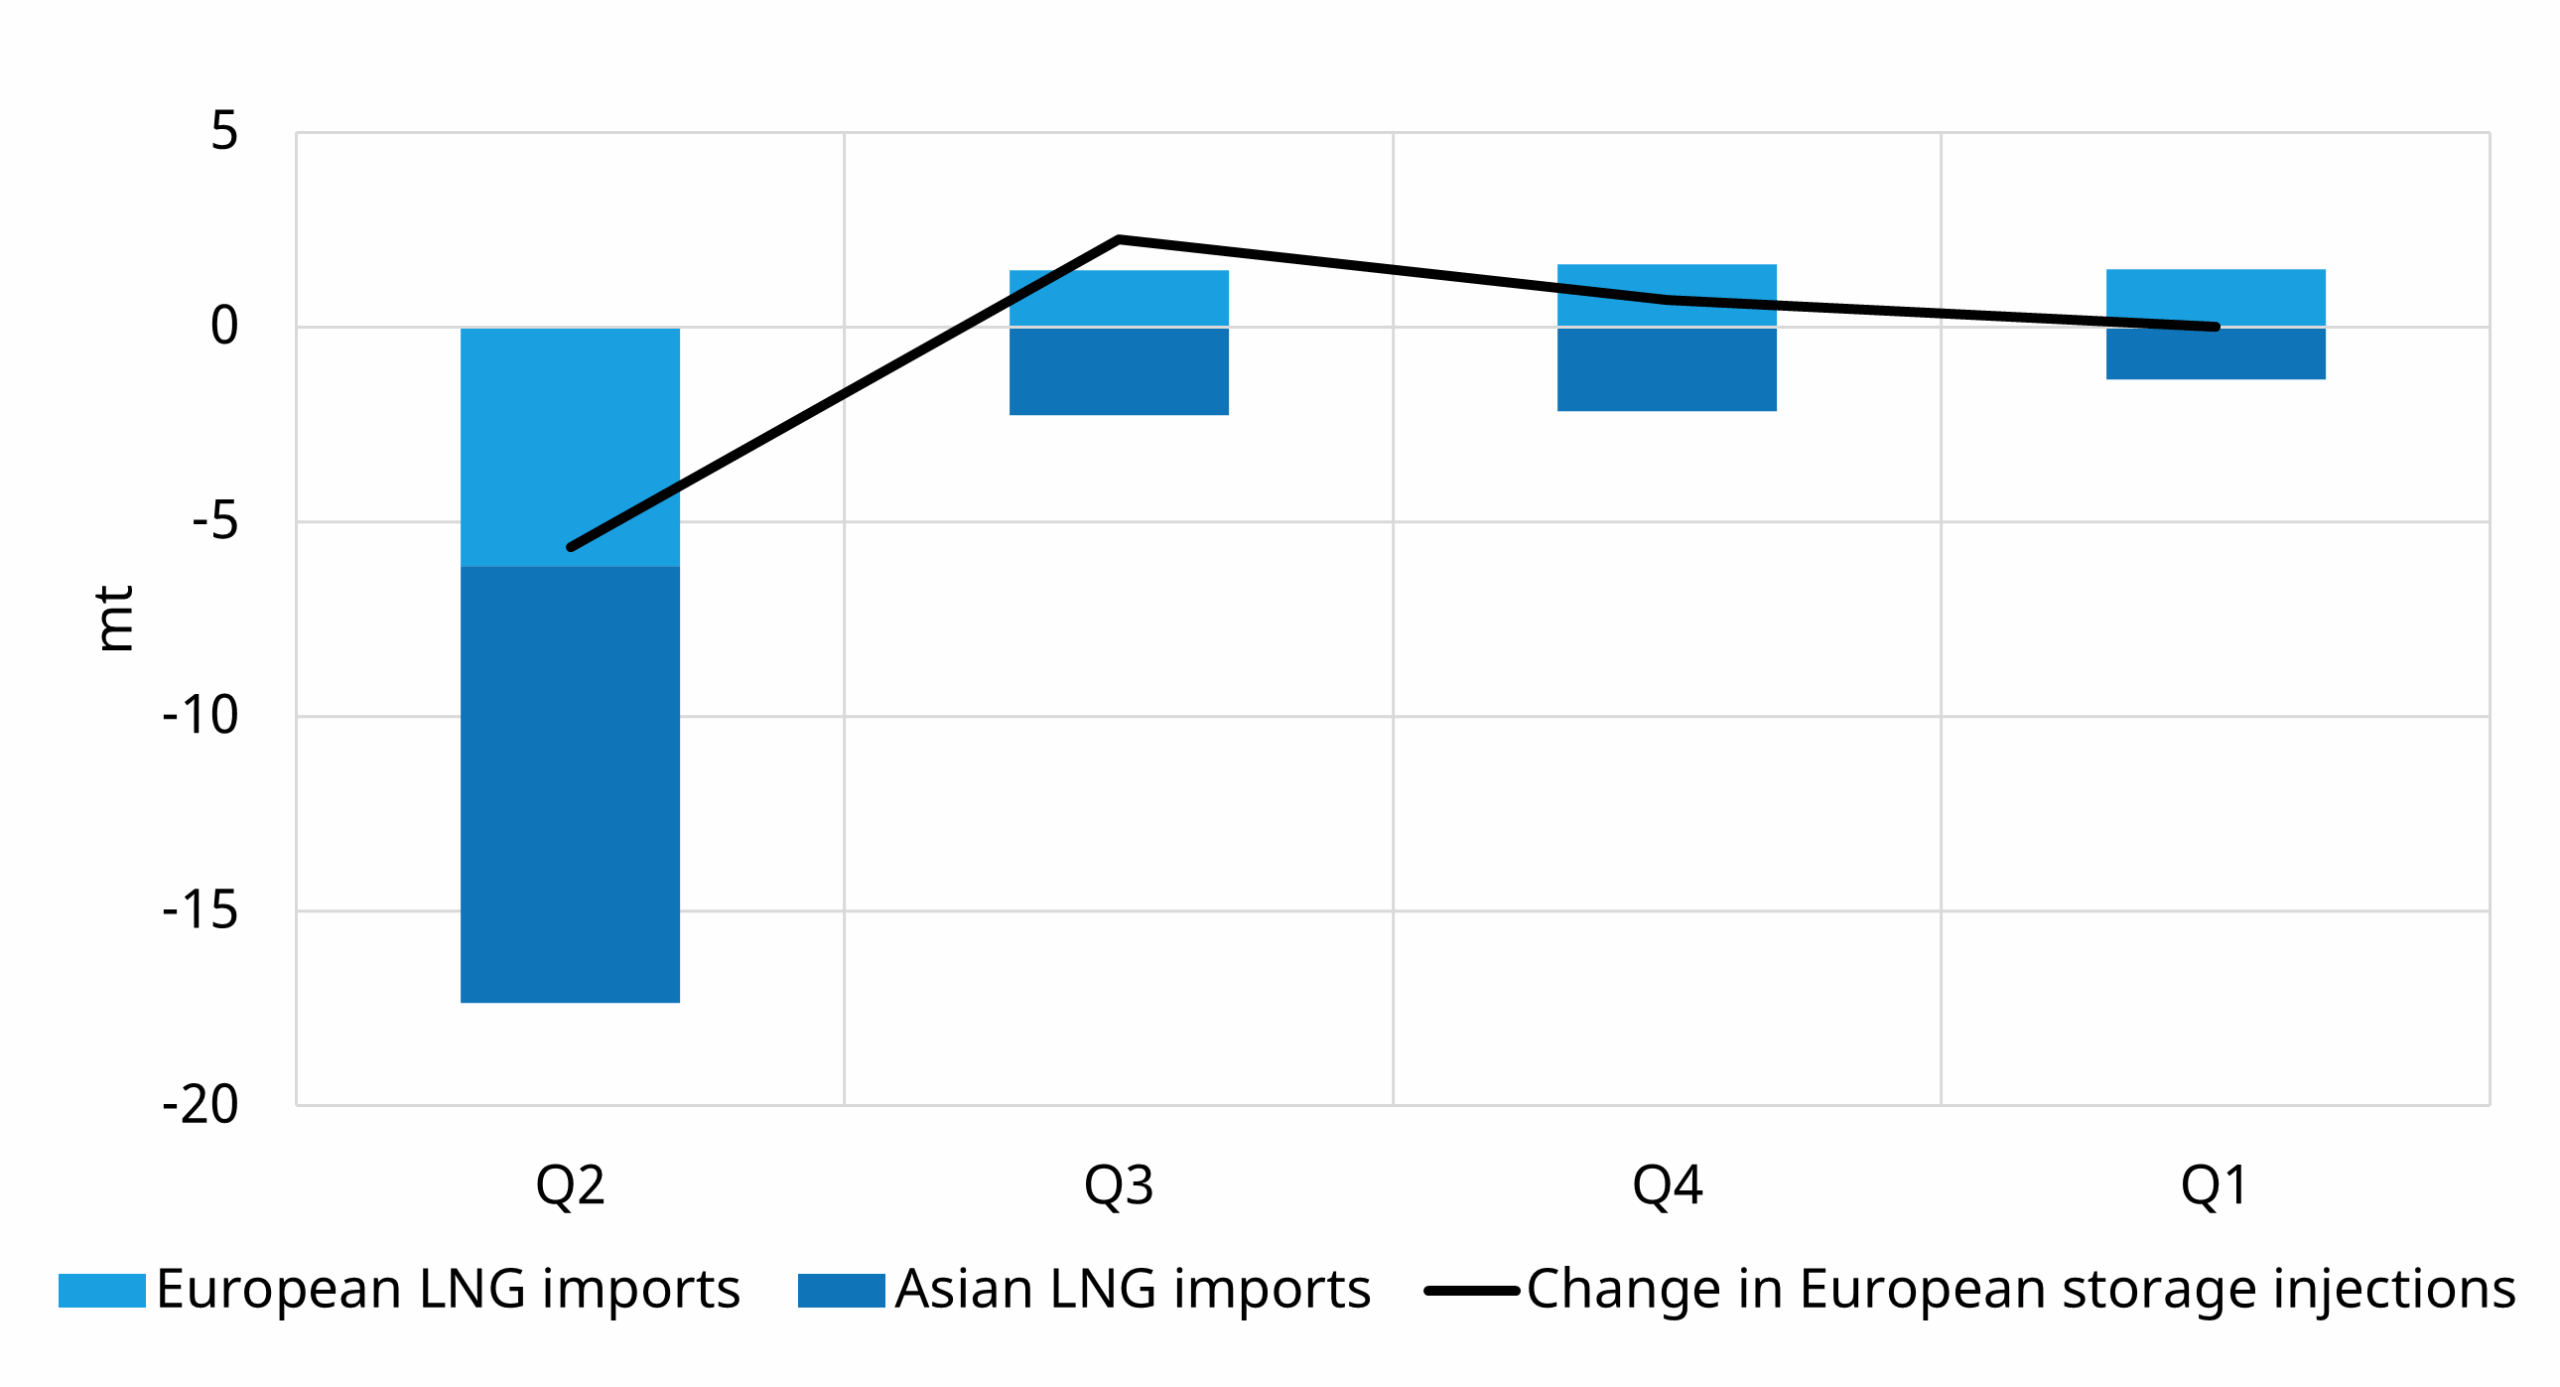
Source: Timera Global Gas Model
While Asian LNG demand reductions do most of the work in offsetting three months of Qatari supply losses, European LNG demand also falls sharply in Q2, primarily due to reduced storage injections.
This is partly compensated in Q3, as higher global gas prices attract more LNG into Europe and increase downstream coal to gas switching, supporting stronger injections.
However, the short term benefits of storage flexibility come with a cost. Lower injections during Summer 2026 effectively push the balancing problem further along the forward curve and into 2027.
In other words, Europe can smooth the immediate shock in summer 2026, but doing so risks tightening the market in following quarters. European policy responses, particularly around storage mandates, will therefore be important to watch as a potential constraint on the ability of storage to dampen the price shock.
Five key takeaways on market impact
Let’s finish by focusing on 5 takeaways that help you navigate market uncertainty as the supply shock evolves:
1. Watch 2027-28 forward prices
The duration of Middle Eastern LNG supply loss is the key market uncertainty. So far the market is pricing losses as temporary vs structural – with losses cushioned by a substantial new LNG supply coming online. Watch for material increases in 2027-28 prices as a flag for more structural risks emerging.
2. Asia will do most of the balancing
LNG demand in Asia is more price elastic at current levels than in Europe. Price responsiveness increases with Qatari cuts as these expose Asian buyers to spot prices. This should act to mitigate the price impact of the supply shock.
3. European storage can cushion a temporary shock…
Europe can partially offset the supply shock via price induced reduction or delay of summer storage injections. But policy response on storage mandates could reduce this cushion.
4. …But this shifts risk down the curve
Lower injections make winter refilling more challenging, transmitting market tightness along the forward curve into 2027.
5. This shock is dynamic and requires dynamics supply & demand analysis
The LNG is facing a major shock with knock on impacts across European gas & power markets. Uncertainty and price volatility are likely to remain elevated. The impact of the shock on asset & portfolio value is dynamically shifting with market conditions – quantifying this impact requires dynamic modelling of LNG supply & demand balances and marginal price formation.
Analysis in this article is a high level illustration of some of the data & insights we provide to our Global Gas Service subscribers. Feel free to reach out to Luke Cottell (Associate Director) luke.cottell@timera-energy.com for more details.