We don’t write about the oil market often, given our focus on power, gas & LNG. But 2020 has been an interesting year and the price of oil has important knock on implications for other energy markets.
“US shale has assumed an irreversible dominance over the marginal pricing of oil”
2020 has been dominated by a Covid induced demand shock that has pushed the oil market into a state of acute oversupply. Global demand was running about 100 million barrels per day in 2019. Average demand across 2020 is likely to be 8-9% lower.
This sharp reduction in demand has seen spot prices plunge in 2020. But perhaps more importantly, a narrative is emerging that ‘peak oil’ demand may have already past and that prices may never recover. This lies in stark contrast to pre-Covid expectations of peak oil around 2030.
The shifting market narratives & major price swings of 2020 reflect a heightened state of uncertainty in a market trying to digest a rapidly changing economic and energy landscape. This is a great time to turn to market prices for objective insights on relevant dynamics from previous price declines and clues as to what may happen going forward.
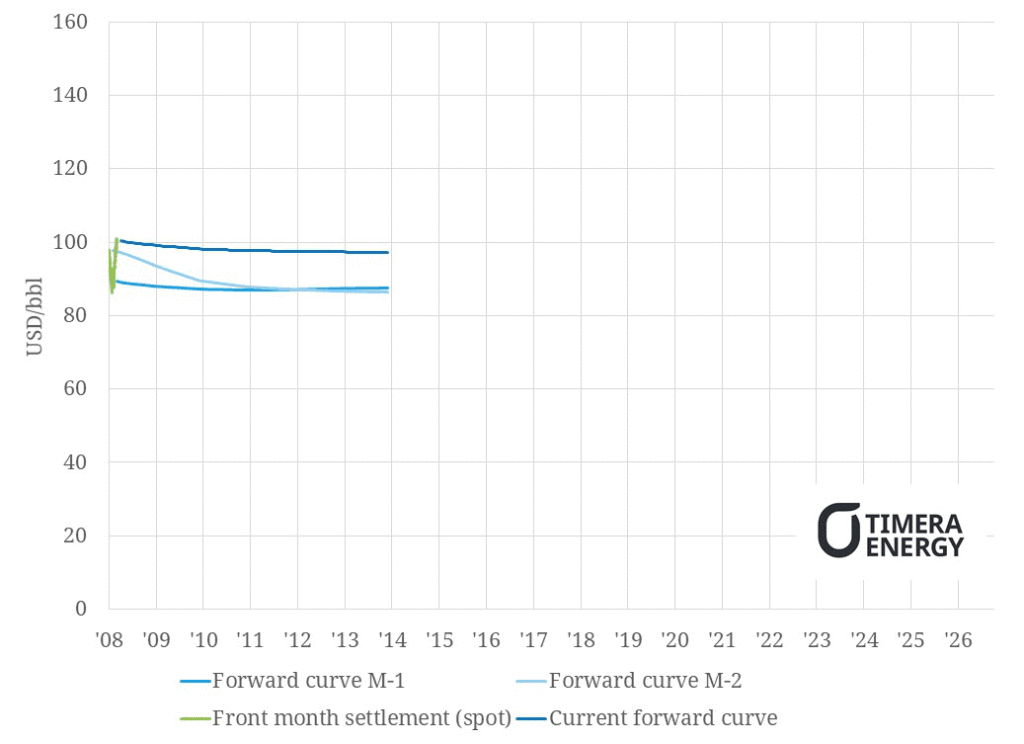
Welcome back to the cinema. As a sequel to our recent TTF gas price animation, we take a look at Brent crude pricing dynamics in Chart 1.
Chart 1: Brent front month price evolution & futures curve animation

Source: Timera Energy, ICE
A 2008 – 2014 recap
The period leading up to and following the global financial crisis saw huge swings in the oil price. At a high level, these can be summarised as follows:
- 2006-08: ‘commodity super cycle’ narrative dominant, with China a big marginal buyer in a tight market i.e. prices surge as strong demand pushes up an inelastic short term supply curve.
- 2009: financial crisis with a rapid and substantial downward rerating of demand expectations i.e. prices crash as demand slides back down an inelastic short term supply curve. OPEC production cuts followed to stabilise the market and underpin a recovery.
- 2010-13: Oil demand recovers relatively quickly post financial crisis (Chinese stimulus a major factor), with conventional oil production costs remaining a strong influence in supporting price recovery back to a 90-120 $/bbl price range.
What the oil market did not see as it entered 2014, was the transformational impact of US shale oil production on marginal pricing. This new reality hit home hard and fast in H2 2014.
The 2014-16 crash
Brent prices across the first half of 2014 were around 110 $/bbl, with the curve in backwardation and anchored around 90 $/bbl. By the end of the year, the Brent spot price was under 50 $/bbl. This marked one of the sharpest plunges in oil price history.
Two factors drove the decline:
- A surge in US shale oil production (with efficiencies driving down production costs)
- The onset of a price war between OPEC and US producers as OPEC failed to agree a production cut response to accommodate the surge in shale output.
Although there was a big move down in spot crude prices in 2014, the back end of the Brent curve remained anchored around 80 $/bbl at year end. It was not until 2015 that the back end of the Brent curve fell to the 60 $/bbl level, where it has largely remained since. US shale officially seized the crown as the marginal driver of global oil pricing.
2016-19 recovery
We slow the animation down from 2016 to show more recent price action. What is interesting across the 2016-19 period is how little the back of the crude curve actually moves.
The Brent curve is anchored around the 55 – 60 $/bbl level by the effects of much shorter US shale production cycles. This reflects a faster market rebalancing force than seen previously where:
- Lower spot prices (e.g. 2016) see the curve fall into contango, choking off drilling of new wells and supporting price recovery back towards marginal production costs
- Higher spot prices (e.g. 2018) see the curve pulled into backwardation, spurring drilling of wells and pushing prices back down towards production costs.
Watch the tail end of the Brent curve between 2016 and 2019. It hardly moves outside a 55-60 $/bbl range, despite big fluctuations in the front of the curve (30 – 80 $/bbl).
Across the 2016-19 period OPEC became OPEC+ as Russia attempted to join the production control club. Production cuts had some temporary impact in supporting spot prices in 2018-19, but OPEC+ has been an unhappy marriage. By the end of 2019, the cartel had been confronted with the hard truth that US shale has assumed an irreversible dominance over the marginal pricing of oil.
2020 and beyond
2020 will be remembered as the year that spot crude prices went negative. But for all the excitement around the ‘transformational’ Covid-driven supply glut, the price driving mechanism in the oil market has not changed.
US shale remains the market balancing force and is likely to retain that role for a long time to come. This is illustrated by the fact that despite what is currently a pervasively bearish market narrative (peak oil etc), the back end of the Brent curve remains anchored above 50 $/bbl.
We would suggest there is a good chance that the low spot prices and curve contango of 2020, mark the start of another mini-cycle like the one we saw across 2016-19. The pace of recovery will strongly depend on Covid driven economic & demand recovery, particularly for aviation fuel. But it’s a bit early to call the end of oil price cycles.
Covid has no doubt accelerated global decarbonisation trends. A Biden White House and/or a Democrat controlled Senate would add further momentum. Decarbonisation could certainly occur at a pace that is much faster than major oil producers are prepared for.
However there appears to be some confusion as to how this may impact oil prices. An oversimplified narrative is circulating that oil demand has peaked, the market is flooded with supply and prices will never recover. Several factors suggest this is very unlikely:
- Covid is in essence a demand shock. It is not a major driver of substitution of oil for other energy sources. There will be changes in a post-Covid world e.g. less business flying, but the structural factors supporting demand (e.g. emerging economic growth & petrochemicals) are not going to be suddenly interrupted.
- Decarbonisation and oil substitution take time. Transformational growth in electric vehicle technology is taking place and grabbing headlines. Internal combustion passenger vehicles may be largely extinct within 15 years. But the impact on global oil demand in a 2020-25 time horizon is small and will take time to ramp up… and the rest of global oil demand is much more challenging to decarbonise.
- History shows US shale production will respond and relatively fast. There is typically a 6-12 month time lag between price declines and production response. Look out for a substantial US supply reduction heading into 2021 to help rebalance the market, supporting prices. There is a good chance that US shale production never makes it back to 2019 levels.
- The marginal cost of US shale production is likely to rise not fall. In both 2016 and 2020 US shale investors have taken massive capital impairments. Major oil producers face severe balance sheet constraints and are slashing capex and freezing opex. And decarbonisation is increasing the risk premium associated with future investment. A higher cost of capital means higher production costs and is supportive of prices at the back end of the curve.
There appears to be some confusion infecting the current oil market narrative. 2020 has brought increasing clarity on accelerating trends away from oil and this is undoubtedly an existential threat to the business model of oil majors. But these dynamics will take time to play out and do not interrupt the current market pricing mechanism.
The oil market remains driven by the marginal pricing dynamics of US shale, anchored by production costs. Current low spot prices and forward curve contango point to oil price recovery over the next 2 to 3 years, not a structural decline.

