A 25% rally in Nov sets up an interesting path forward
This time last year European gas prices had started their descent into a pronounced winter slump. Weather was mild, demand across all segments was weak. The energy crisis market tightness that kicked off in summer 2021 was officially over… or was it?
The benchmark Calendar 2025 TTF price started last winter around 43 €/MWh. By late Feb 2024 this price had fallen by about 35% to 28 €/MWh.
A steady rally since Q1 saw TTF prices hit new highs for 2024 last week. Most of the front 2 years of the curve also pushed through levels that marked the start of last winter’s price slump (e.g. TTF Cal 25 rallied back to 45 €/MWh).
European power prices are moving higher with gas, given the key marginal price setting role of gas-fired plants.
In today’s article we look at what is driving renewed European gas price strength, ahead of a deeper dive into LNG market balance & price evolution in our webinar on Wed this week.
Visualising the TTF rally
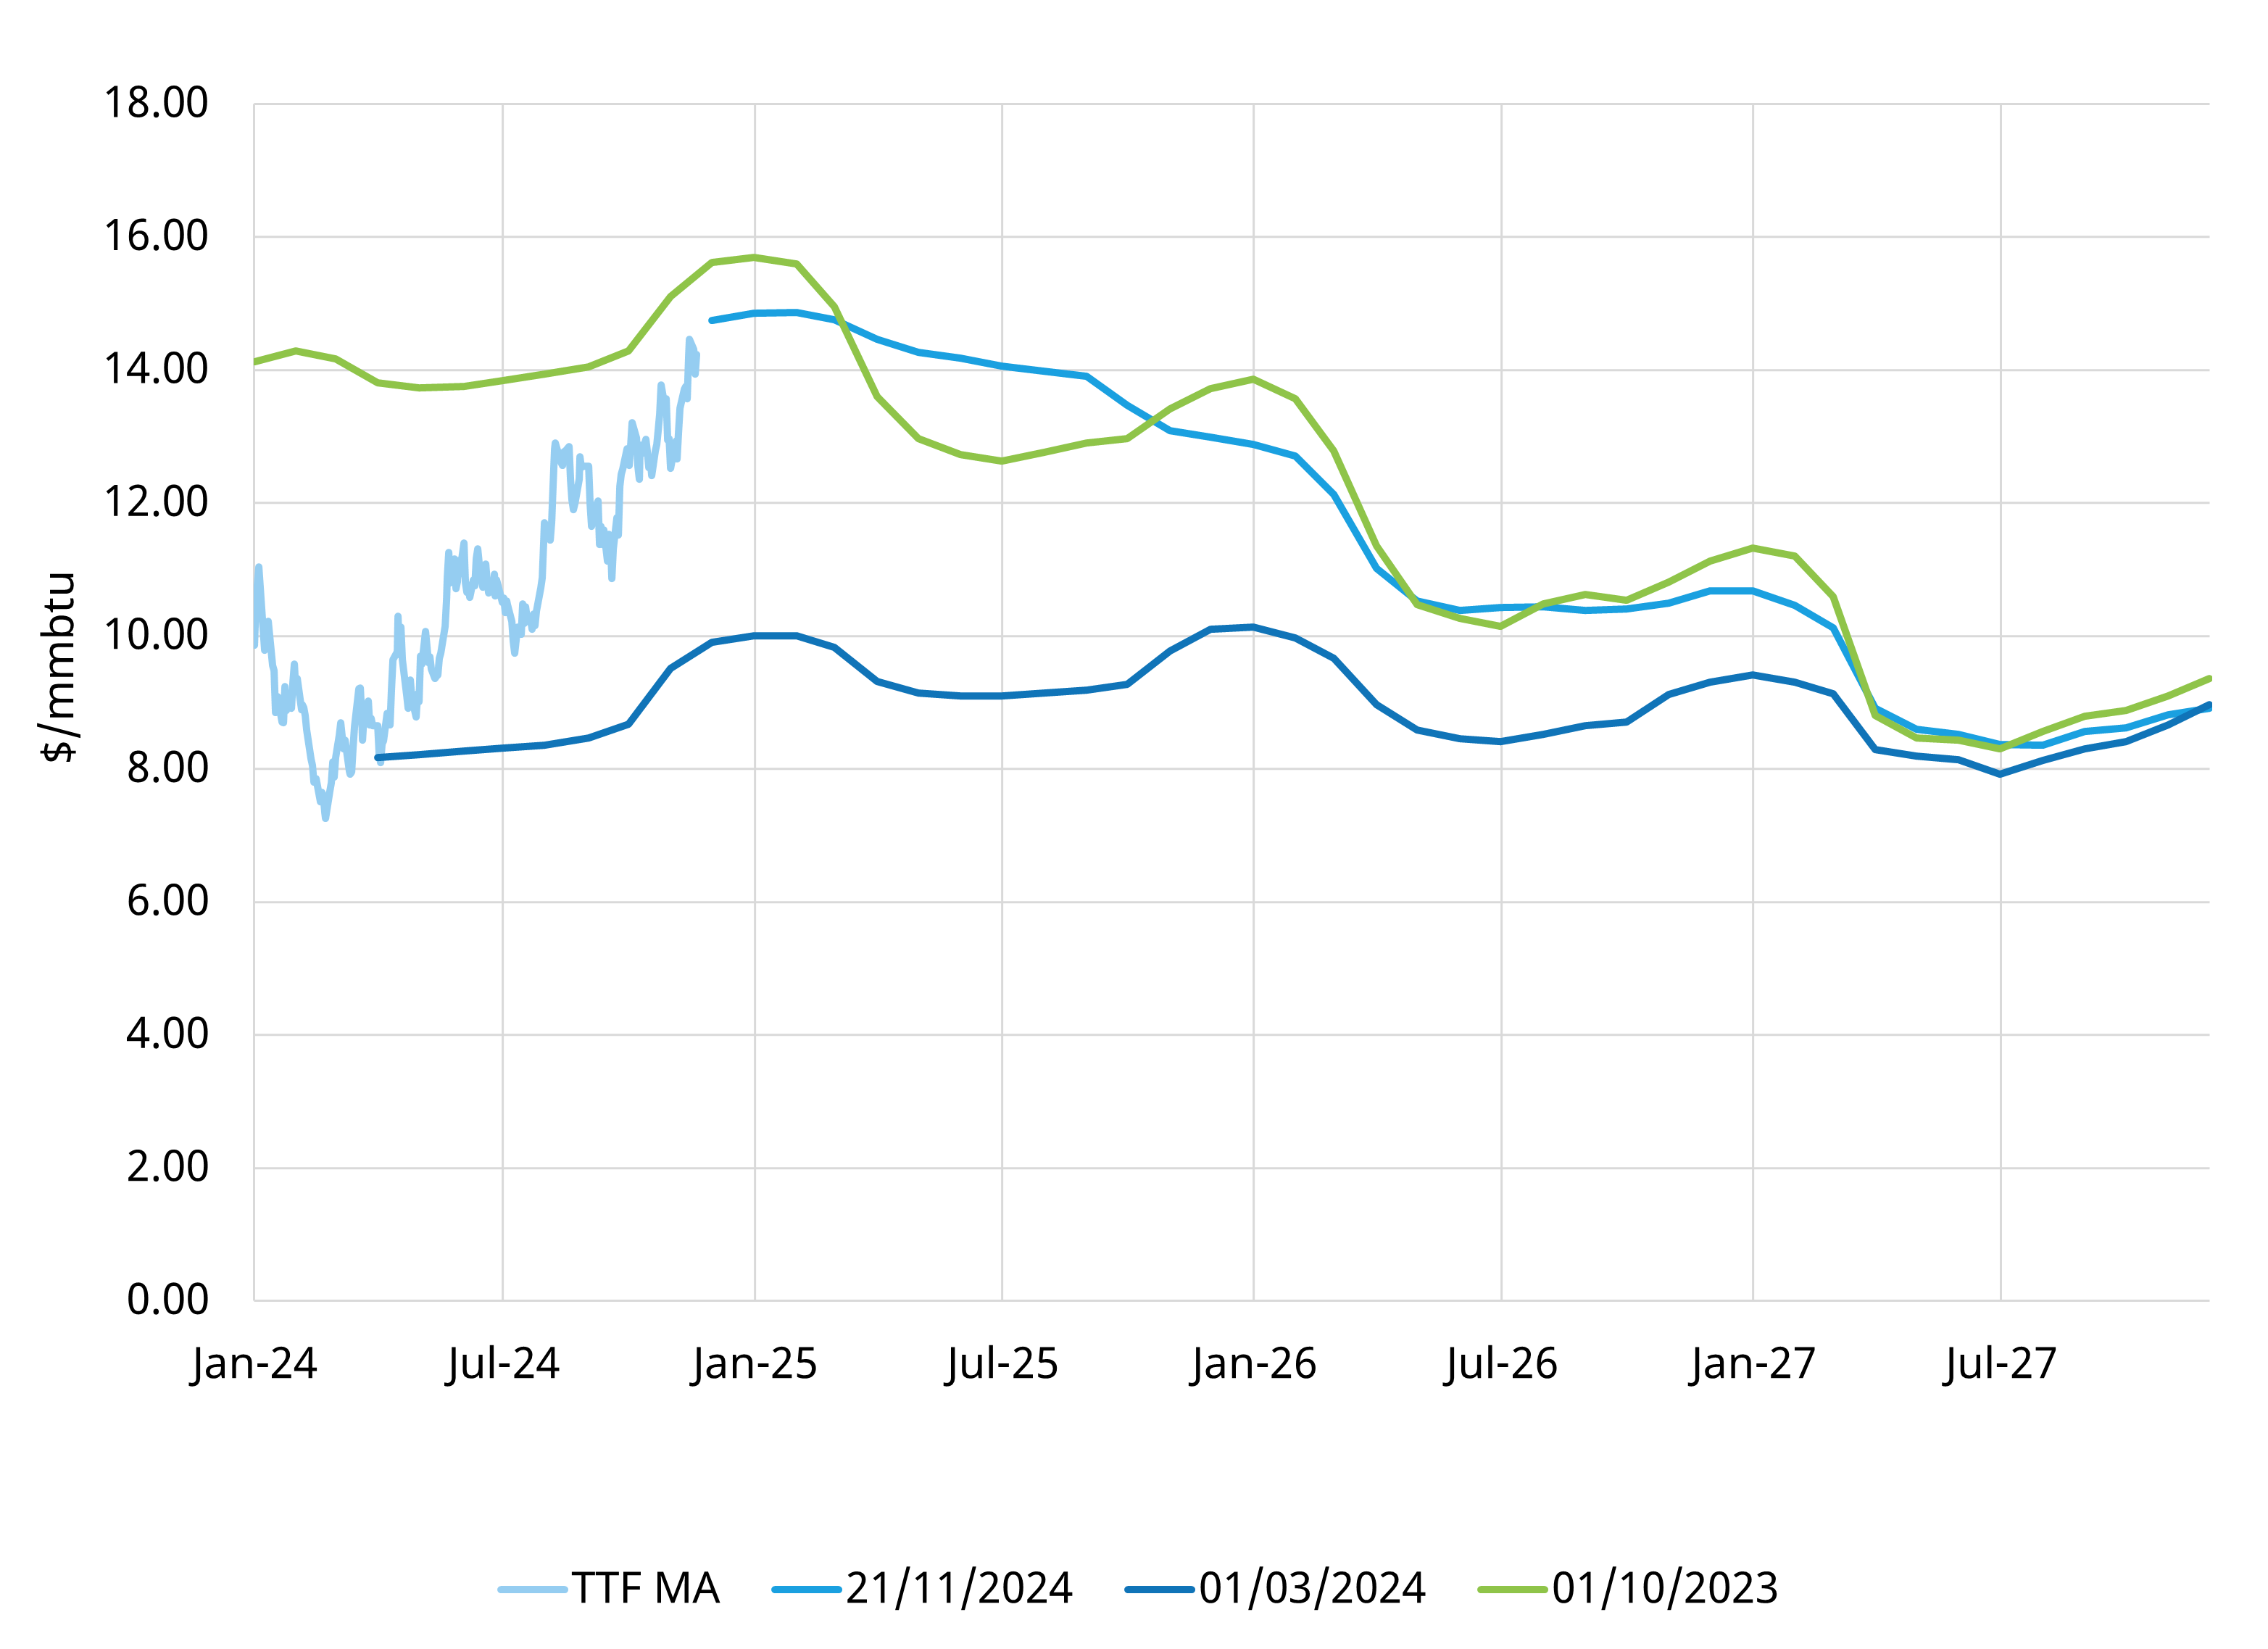
Chart 1 shows the evolution of the TTF spot (front month) price this year (light blue). It also shows the evolution of the forward curve via 3 different snapshots in time:
- Oct 2023 (light green) – the beginning of last winter
- Mar 2024 (dark blue) – the bottom of the winter price slump
- Nov 2024 (mid blue) – current forward curve
The chart shows that movement in the forward curve across the last 12 months has been focused on the front 1-2 years. Prices in 2027 have been much more stable.
Backwardation has been increasing as the front of the TTF curve has pivoted higher since Q1, while remaining anchored from 2027. The rally in 2026 prices has been supported by delays in the ramp up of new LNG supply projects under construction.
European hub (TTF) & European LNG (NWE DES) prices have also recently moved to a premium over Asian LNG prices (JKM) at the front of the curve. This is signalling an increase in LNG flows into Europe across this winter.
Let’s take a look at the drivers of this re-emergence of European gas market tightness.
What is behind the 2024 rally?
The rally this year is consistent with the analysis we have been publishing in our Quarterly Gas Service:
- A structurally tight LNG & European gas market regime across 2024-25
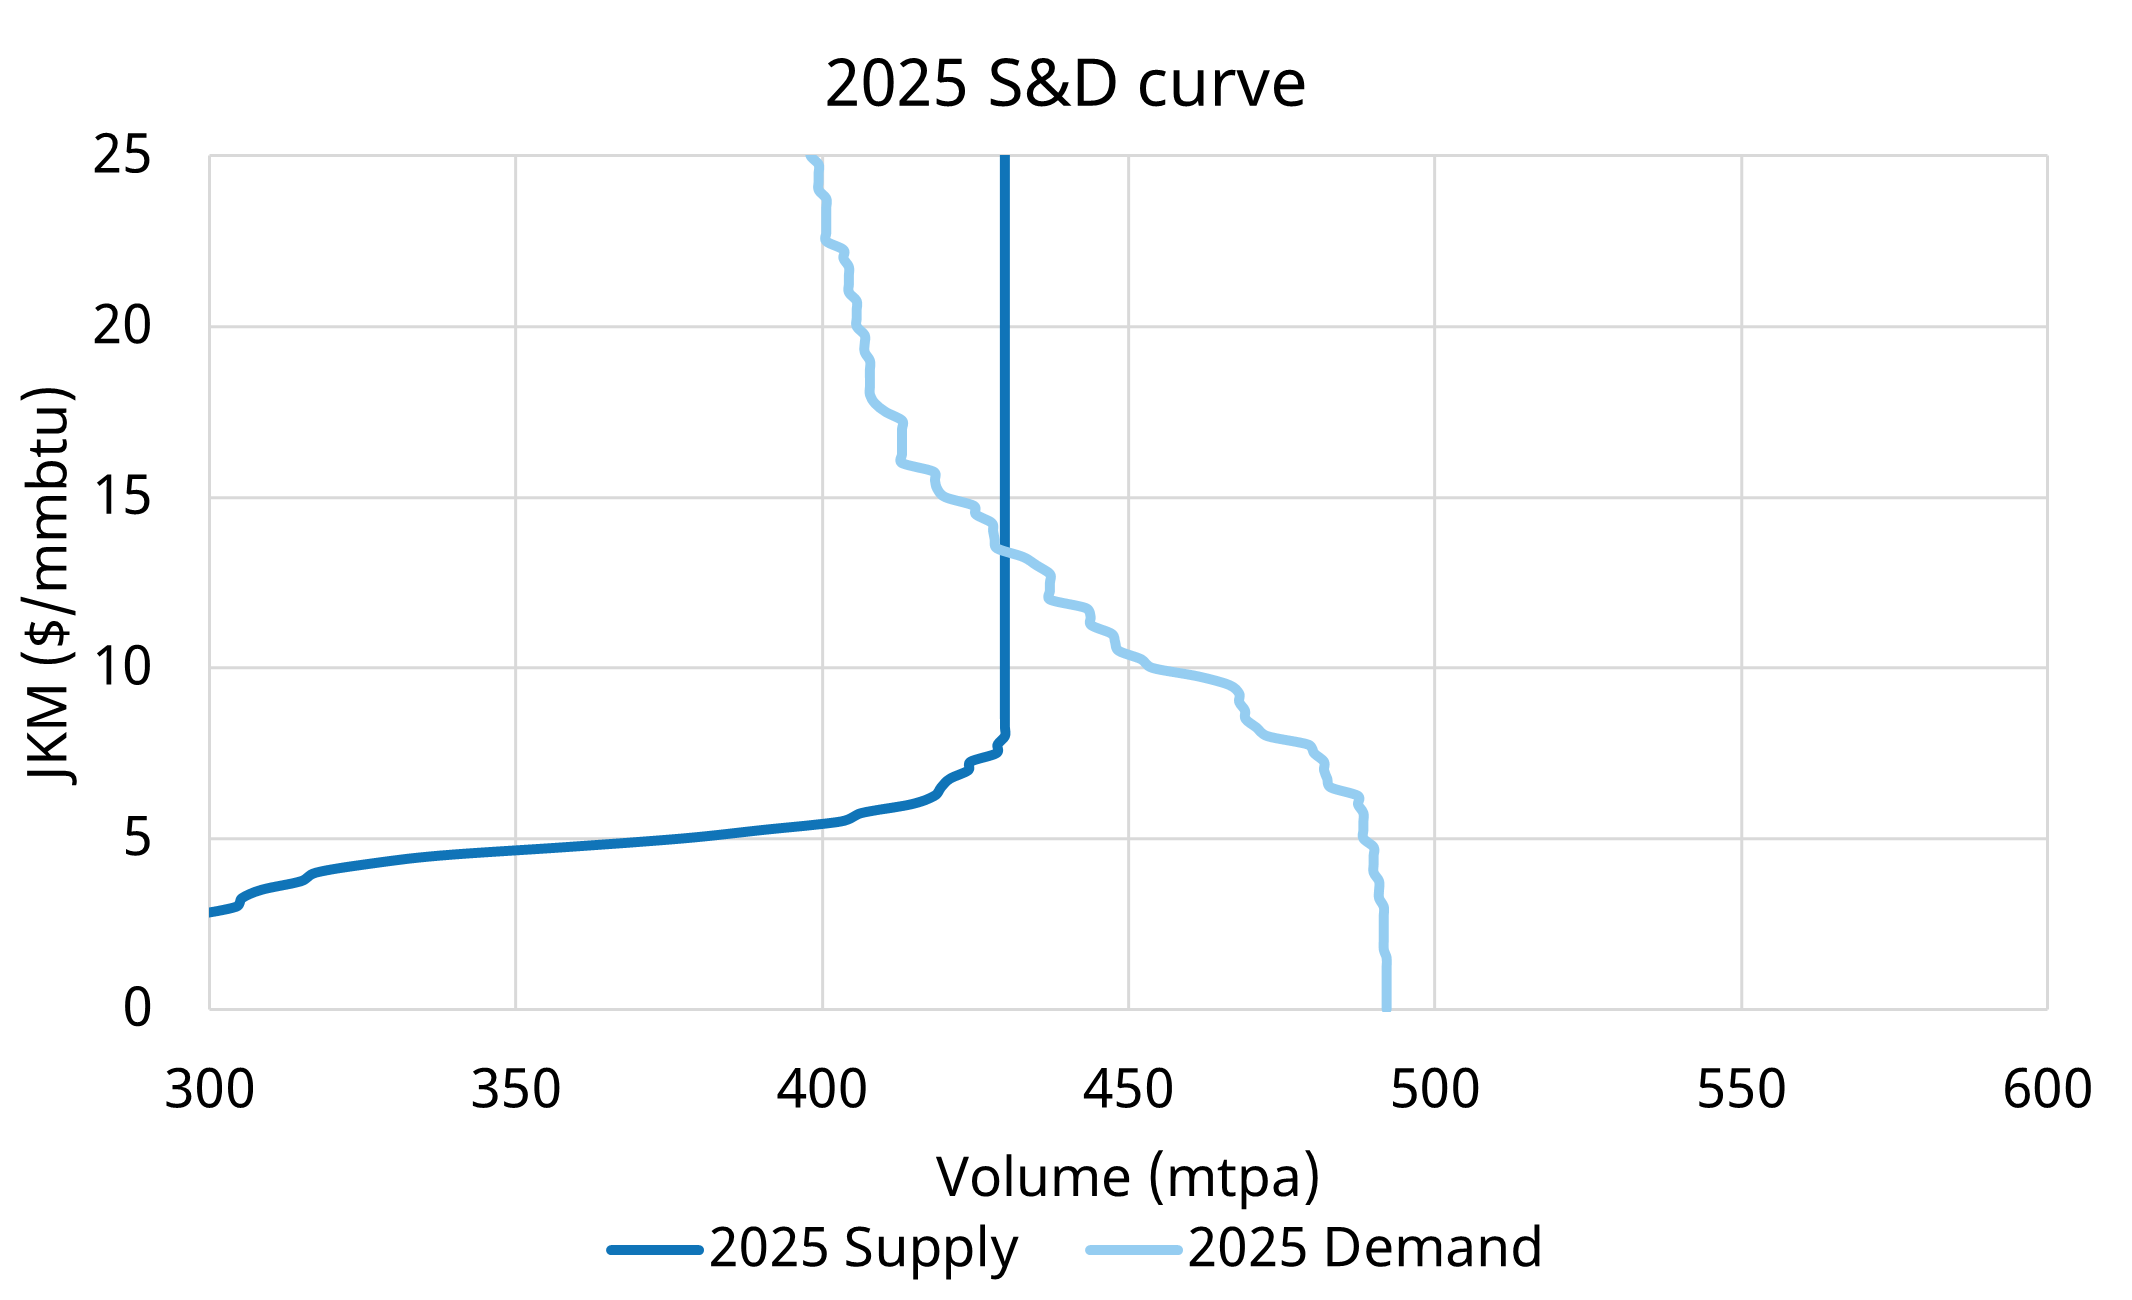
- Relatively inelastic global supply & demand as a result (see Chart 2)
- Upside price risk from recovery in demand expectations against inelastic supply
- A new LNG supply wave ramping up from 2026, acting to dampen price levels & volatility (holding down the back end of the forward curve).
If you want more information on this analysis feel free to reach out for a sample copy of our Global Gas Report.
In Chart 2 we show the 2025 combined supply & demand balance of the LNG market & European gas market. Our analysis covers both these markets given the key co-dependency of price formation across them.
Chart 2: 2025 global supply & demand curves
Source: Timera Q4 2024 quarterly gas service analysis
The price rally from late Q1 into Q2 2024 was driven more by a recovery in Asian LNG demand, acting to tighten global market balance. The Q4 price rally has been more focused on drivers in Europe, including:
- Russian cuts: the threat of further Russian supply cut risks via Ukraine, linked to an ongoing contractual dispute with OMV
- Colder start to winter, with softer wind conditions supporting power sector gas demand
- Storage inventories depleting faster than last year
- Generally bearish / underweight market sentiment & positioning as a result of weak demand fundamentals this year.
Storage depletion is an important transmission mechanism from the current winter across the 2025-26 horizon of the forward curve. This is because storage mandates effectively mean that the greater inventory depletion this winter, the more injection demand that will be required to meet mandate volumes going forward.
What are the implications of the current market set up?
The global gas market is set to go through a key regime transition from 2025-27. The current market set up increasingly points to this being far from a smooth process.
In our webinar this Wednesday we will discuss more detailed analysis of:
- The Q4 2024 rally & what’s driving global gas prices
- Shift in global S&D balance 2025-27
- Growing role of Asian demand flex setting prices
- Impact of higher Henry Hub on LNG market
- Commercial implications of market moves on asset value & portfolio construction
More details below if you would like to join the webinar.
Webinar recording available
Thank you for attending our webinar “Absorbing the supply wave” – how demand and supply side flex mechanisms will balance the global LNG market, which took place on Wednesday 27th November 2024 09:00 GMT (10:00 CET, 17:00 SGT).
The webinar was focussed on:
- What’s been setting global gas prices?
- Importance of market flex in the coming regime
- Overview of LNG supply response & Asian demand flexibility
- Demonstrating market flex impact on marginal price formation through (i) HH price impact (ii) Asian demand growth trajectory
Click here for a recording of the webinar.
Click here for a copy of the webinar slidepack.
If you are interested in a sample copy of our Global Gas Quarterly Report & Databook, or further information on the bespoke services we offer, feel free to contact David Duncan (Director) david.duncan@timera-energy.com or David Stokes (Managing Director) david.stokes@timera-energy.com
