There is a sort of savage beauty to extreme market volatility. Theories and absolute beliefs are up ended. Transaction flow drives prices to levels that clear the market.
“The European gas market is being buffeted by two major forces”
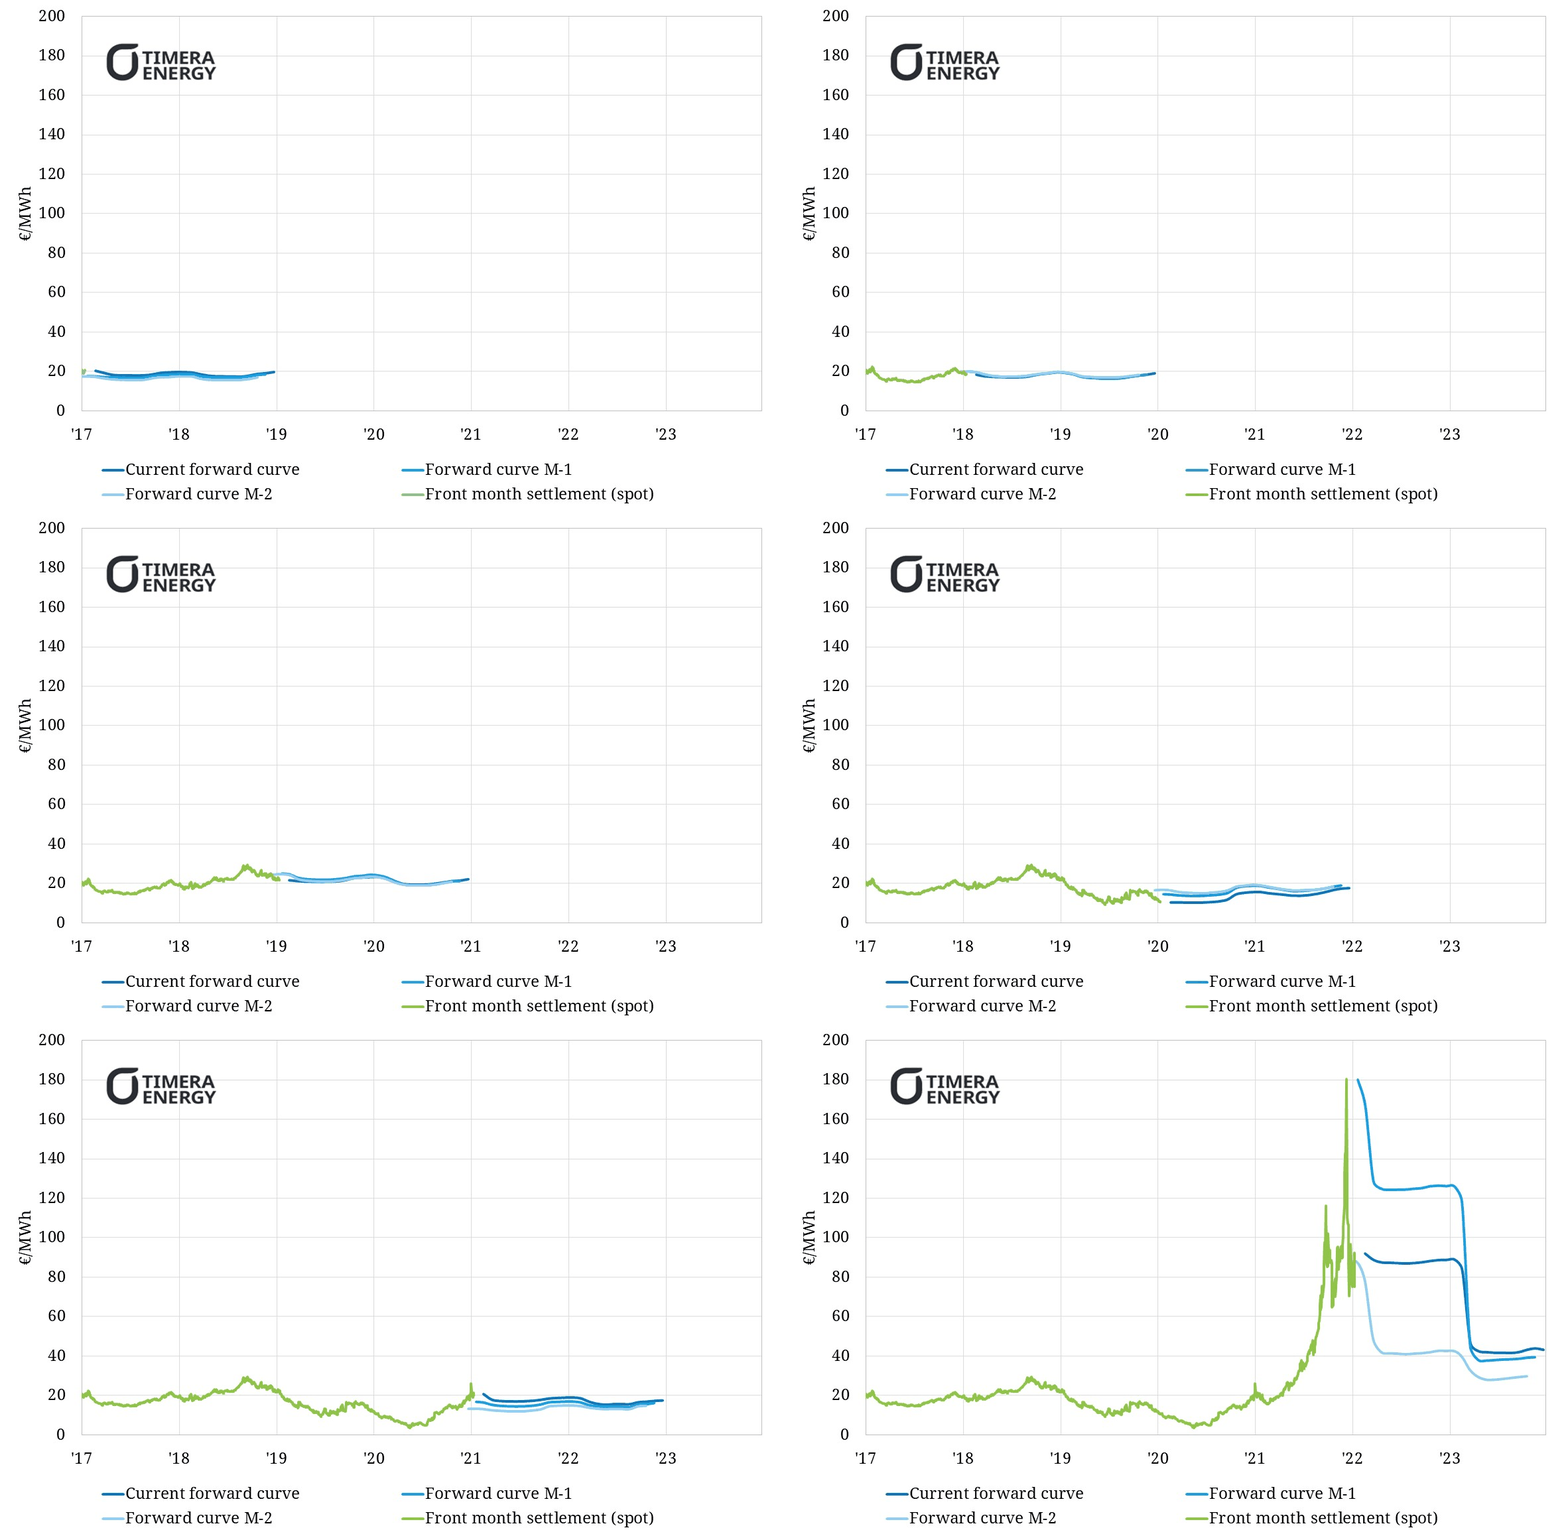
To understand just how extraordinary the volatility of the last 12 months has been, Chart 1 shows an animation of the evolution of:
- TTF front month prices – the green line
- TTF month end forward curves – the 3 blue lines representing the last 3 monthly curves (darkest blue = most recent, lightest blue = 2 months prior).
No introduction really required, the chart tells the story. But one opening comment: look at the difference between the level of 2022 prices across the last 3 month end forward curves (28 Jan 22, 31 Dec 21, 30 Nov 21) as the animation pauses at the end.
The trading range for 2022 forward prices across the last 3 months is substantially larger than the entire trading range history of TTF since inception in the period prior to this. Power price volatility, driven by gas prices at the margin, has also smashed all records.
Beauty is in the eye of the beholder, but there is no debating just how savage European energy price volatility has been across the last 3 months.
The lead up to the face ripping rally of 2021
We have set up the animation to move through the 2017-19 period at a faster speed. TTF spot prices across this period traded in a 10 – 25 €/MWh range, with the forward curve relatively flat compared to the more pronounced shape of the last two years.
This was a period of relatively orderly market behaviour where coal / gas switching ranges anchored price levels. Although when you zoom in across this period (as we did with a previous 2016 – 19 TTF animation), you can see some substantial market swings as prices were pushed around by factors such as surplus LNG flows into Europe and nuclear outage issues.
We slow down the animation in Chart 1 from Jan 2020 to make it easier to digest the extreme volatility across the last two years. 2020 was dominated by a record crash & then rapid recovery which we showed in a separate animation here.
The 2020 Covid demand shock driven crash completely wrong footed a gas market which was actually facing a rapidly tightening supply situation. This was the set up for the exponential price rise that took hold in summer 2021.
The big surge & the current state of play
Last autumn we wrote about 5 factors behind the recent price surge:
- Russian flow constraints (both physical & political)
- LNG diversion to Asia / Latin America
- Tight European storage inventories
- Norwegian maintenance (Covid related)
- Power sector dynamics (surging carbon prices & a lack of price response given exhaustion of coal switching).
As these factors started to really bite last summer, Winter 2021 prices surged opening up a huge backwardation in the forward curve. Market perception to start with was that this was largely a single winter issue.
As is often the case in commodity markets, pronounced backwardation in Q3 2021 was a bullish signal of an acute near term supply shortage. This led to an even bigger price rally to follow in Q4 2021.
The Chart 1 animation across Q4 shows Winter 2021 tightness dragging up the whole TTF forward curve, as the market priced in a more extended period of supply tightness across 2022. This repricing of 2022 gas was particularly severe in Dec when e.g. the Summer 2022 contract rallied from 45 to 130 €/MWh across the space of 3 weeks.
It is interesting to note however that through all of the fireworks of Q4 2021, 2023 TTF prices have stayed relatively anchored to gas / coal switching curve ranges. 2023 gas prices have also rallied substantially across the last 6 months, but this has been consistent with a near doubling in carbon prices.
Current state of play in the European gas market
Four of the five key TTF drivers listed above continue to support gas market tightness today. However one has reversed to become a source of significant relief: LNG flows.
There has been a deluge of LNG imports into Europe in Q1. It has been a relatively mild winter in Asia, with buyers carrying high volumes of contracted LNG cover after the scare of last winter. A soft Asian market so far in 2022 has seen JKM / TTF spreads invert violently resulting in record daily LNG send out in both UK and Continental European terminals.
The other four drivers remain an issue. Russian flows in particular have been even lower in 2022 than in late 2021 e.g. with reverse flow at Mallnow and volumes below ‘take or pay’ levels at Velke (on the Ukraine route).
Low Russian contract nominations are an important factor here with month-ahead TTF indexation formulas pricing off very high Dec price levels. These are well above current day-ahead prices, reducing the incentive for buyers to nominate gas, a factor which should ease into Feb resulting in a recovery in nominations.
The European gas market is currently being buffeted by two major forces:
- Expectations for LNG imports to remain strong into summer
- Russian flow uncertainty and the ongoing threat of the Russia vs Ukraine conflict (impacting both existing flows & the future of Nordstream 2).
These conditions continue to drive a high level of uncertainty as 2022 unfolds. With very limited price response from a fully switched power sector, an inelastic supply curve is set to drive ongoing volatility in both gas & power markets.

