2023 will go down as the year of the nasty recession that never arrived. Global economies have so far absorbed the ‘left – right – left’ punch combination of surging interest rates, stubborn inflation & high energy prices, without falling apart and shedding jobs.
Market consensus was firmly focused on a sharp recession in the first half of 2023. When this didn’t arrive expectations slipped back into the second half.
By late summer global markets started to lose patience and reprice. Two key macro benchmarks began to rise in tandem: crude oil prices and long term interest rates (bond yields).
This is a dangerous combination that is not friendly to economic growth or financial stability. Energy prices are a key driver of inflation, so rising crude prices can fuel further upwards pressure on interest rates.
Today we look at what is driving crude and long term rates higher and how this backdrop may cause a period of unusually high market volatility.
Crude: 2 steps forward 1 step back
Chart 1 shows the evolution of the Brent crude forward curve across the last three months.
Chart 1: Brent forward curve evolution since late summer

Source: Timera Energy, ICE
Between March and June this year, front month Brent made five attempts to break below the 70 $/bbl level. Fears of global recession were high and the crude market was absorbing US sales of Strategic Petroleum Reserve (SPR) volumes (somewhat un-strategic sales in hindsight).
The lowest curve on Chart 1 shows a relatively flat forward curve in late June with front month prices in the low 70 $/bbl range. 3 months later front month prices had risen 30% to 95 $/bbl (the top line on the chart), with a pronounced backwardation opening up.
Across the same period the US dollar also surged higher against other currencies, particularly across emerging economies. So crude prices for example in India hit an all time high price (in rupee terms) as crude rallied across Q3, higher than when crude surged to 150 $/bbl in 2008.
Importantly long dated crude prices have also risen significantly this year, rallying about 10 $/bbl between Jun and late Sep. This rise reflects the more structural impact of rapidly rising interest rates on US shale production costs. Rising cost of capital for upstream oil investment could well underpin a more structural multi-year rally in crude prices.
However markets don’t move in straight lines. Across the last week, crude prices have retreated fast as shown by the middle curve in Chart 1. The combination of surging crude prices & interest rates has temporarily spooked the crude market (& other commodity markets), given potential negative impacts on economic growth & demand.
What’s behind rising long term interest rates
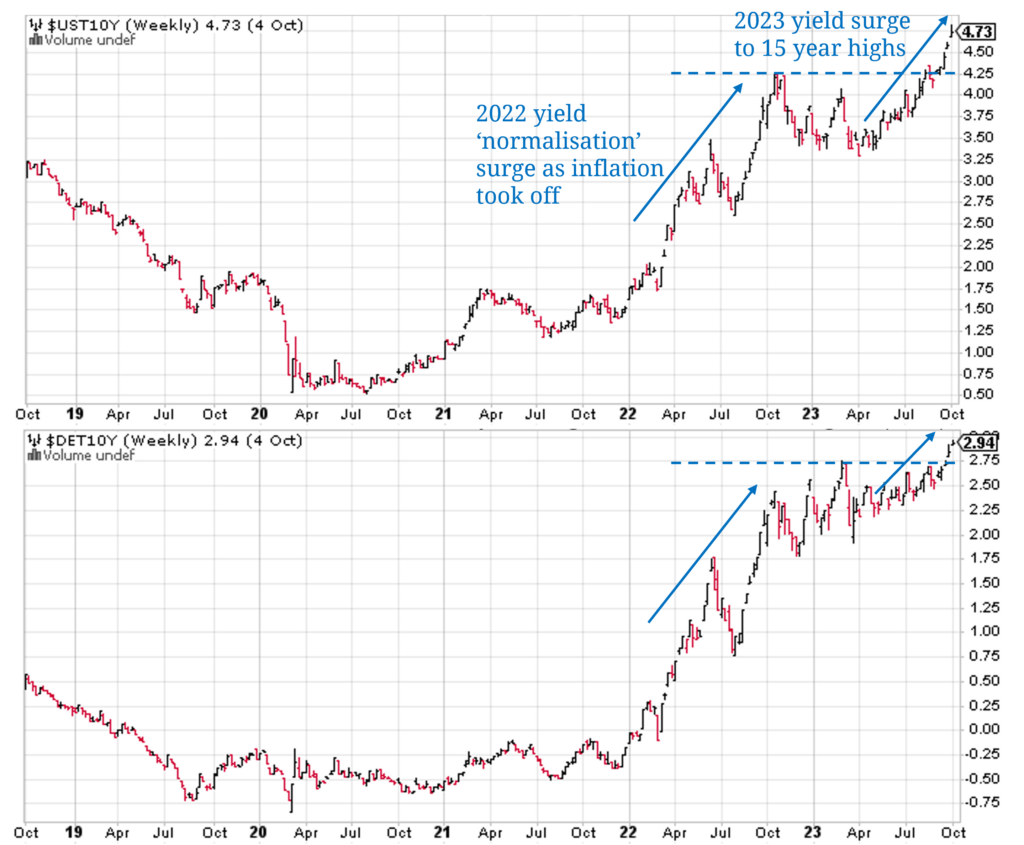
We focused last month on the impact of rising short term interest rates on the cost of capital for energy projects. Across the last 4 weeks it has been the turn of long term interest rates to surge to their highest level in 15 years as shown in Chart 2.
Chart 2: US 10 year yields (top panel); German 10 year yields (bottom panel)
Long term interest rates (or yields) on government debt are set by the market (albeit with heavy intervention from central banks since the 2008 financial crisis, in the form of quantitative easing or bond purchases).
The level of yields is a key driver of investment across all industries & asset types. Long term yields effectively underpin:
- The cost at which governments can borrow (i.e. the ‘risk free rate’)
- The structural long term borrowing cost for corporate balance sheets & their cost of carrying risk
- The hurdle rates at which cashflows are discounted to value assets & companies
- The value of the key source of collateral that supports the global financial system.
This is why a renewed surge in yields across the last few weeks has started to spook financial & commodity markets. It directly impacts the value and cost of capital for everything.
The problem of rising long term interest rates is further exacerbated by a huge & growing supply of government debt across the world’s developed economies.
Just like commodity markets, interest rates are driven by supply & demand. As the supply of debt (i.e. government bonds) grows, yields need to move higher to clear the market (all else being equal).
The US alone needs to issue more than USD 8 trillion by the end of next year in order to fund its budget deficit & refinance existing debt. It is an understatement to say that this represents a very large volume of new supply – to put it in perspective it is roughly 4 times the size of Biden’s 2021 Covid Infrastructure Bill and 2022 Inflation Reduction Act combined. And that $8 trillion is just the new supply of debt across next year.
The US is not alone in carrying a massive debt load. The US has a debt to GDP ratio of around 130% (vs e.g. Italy ~150%, Spain ~120%, UK ~100%). Japan’s is double that at ~260%. Most developed countries are in a similar position, issuing huge volumes of new debt each year.
Watch out for volatility
The end game for absorbing this vast supply of government debt is likely to be accumulation via central bank balance sheets (i.e. some form of further quantitative easing albeit with a different name tag). But monetary easing against a backdrop of stubborn inflation pressures is the policy equivalent of walking a tightrope. The impact of rising energy prices on inflation adds an unpleasant crosswind.
It may take a bout of disorderly markets to induce central banks to step in. And the policy response may be far from smooth. Watch out for a volatile couple of years across both financial & commodity markets.
————————————————————-
Join our upcoming LNG webinar
Title: “A new lens” – how shifting pricing dynamics are set to drive LNG portfolio value
Date: Tues 17th Oct 09:00 BST (10:00 CET, 16:00 SGT)
Registration link here, free to attend
Focus:
- Market regime shift set up from 2024 into 2030s
- Marginal drivers of regional price spread evolution (e.g. HH vs TTF vs JKM)
- Evolution of price volatility & correlation + value impact
- Why crude vs gas pricing is set to be a big LNG portfolio value driver
- Brent SPA case study quantifying valuation breakdown