A lot of value has been lost by market participants expecting 2023 would turn out like 2022. Plenty more value is on the line expecting 2024 will turn out similar to 2023.
Market history is a rich source of useful information. But looking in the rear-view mirror to predict future market outcomes is a dangerous hobby.
The global gas market is far from a state of stable equilibrium. Russian supply cuts represent a structural supply shock still reverberating through the market. And the inelastic nature of global demand response under a new regime of higher prices has driven up market volatility.
In today’s article we set out our view of the evolution of gas market volatility, focusing on the next 3 years (2024-26). We do so based on analysis from our global gas market model which focuses on quantifying the impact of uncertainty across different market outcomes.
2024-26 requires a respect for uncertainty
The biggest challenge in analysing gas market evolution, particularly across the next 3 years, is recognising uncertainty. Global market balance & pricing are currently very sensitive to factors such as:
- A recovery in Asian or European demand (e.g. due to a cold northern hemisphere winter)
- Supply interruptions (e.g. Western Australian LNG terminal strikes or further Russian export cuts)
- Impacts of a sharp recession & rising cost of capital
- Liquefaction project delays (e.g. next wave from 2025).
Chart 1 shows our modelled JKM (Asian LNG benchmark) price sensitivity to 10 mtpa changes in global market balance across the next 3 years.
Chart 1: JKM price ranges for changes in global LNG market balance (mtpa)
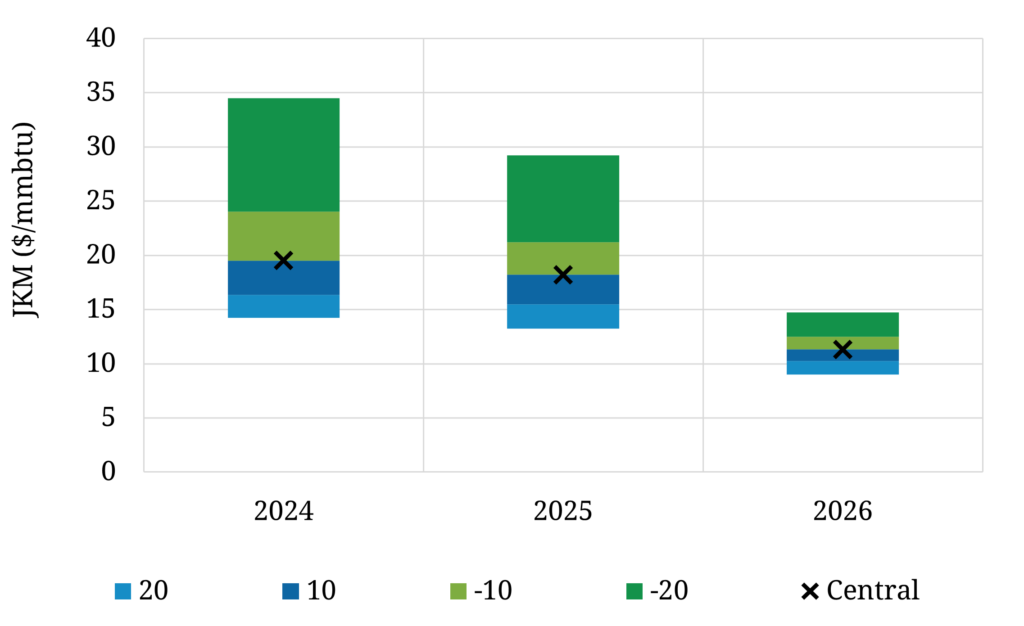
Source: Timera Energy global gas model
Some key takeaways from the chart:
- Tight regime: The global market remains tight across 2024-25, given lost Russian volumes exceed net global demand reductions (despite European storage inventory driven price weakness in Summer 2023)
- Price sensitivity: Relatively small changes in market balance (e.g. factors listed above), can cause material moves in price i.e. both supply & demand response is inelastic (see next section)
- Asymmetric upside: The chart shows asymmetric upside price risk given greater inelasticity of supply & demand above the margin
- Volatility: Inelastic supply & demand response supports higher levels of expected price volatility (vs pre-crisis conditions and probably vs 2023)
- Transition: Tight regime conditions (above) are likely to ease by 2026 as large volumes of flexible new supply enter the market.
Let’s dig into price drivers in a little more detail.
Inelastic response to drive prices in 2024-25
The analysis in Chart 1 comes from our global gas market model, used by a number of the world’s leading LNG & gas portfolios. The model has a granular build up of global market balance, but its unique strength is its focus on the key sources of marginal supply & demand flexibility that drive prices.
Chart 2 illustrates the evolution of JKM price elasticity across the next 3 years. For a given change in LNG market supply & demand balance (horizontal axis), the charts show the resulting price change impact (vertical axis).
Chart 2: JKM price elasticity 2024-26
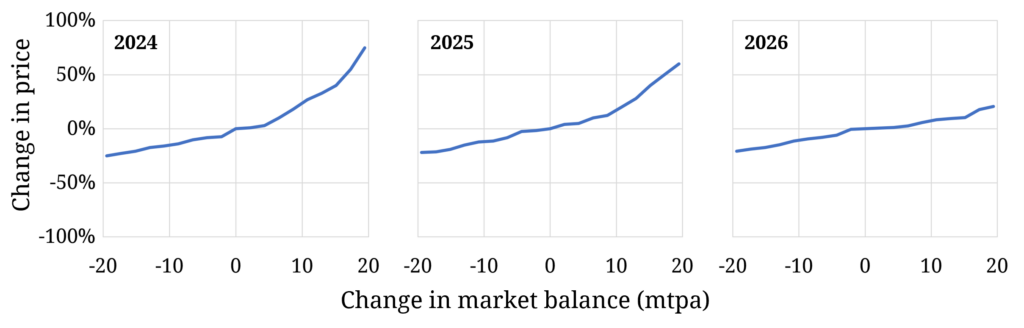
Source: Timera Energy global gas model
The 2024 & 2025 elasticity curves illustrate
- strong price sensitivity to changes in market balance (supporting higher volatility)
- asymmetric price risk to the upside.
Price response below the margin (i.e. below 0%) is greater given price support from European power sector switching and ultimately US cargo cancellation. But price response above the margin is driven by much less responsive tranches of Asian demand e.g. industrial demand, oil switching & Asian power switching.
It only takes a relatively small tightening in market balance across 2024-25 to send the market back into a world of inelastic demand response setting marginal prices & driving high volatility. That is a different environment to what we have experienced so far in 2023 where weak demand and very high European storage inventories have dampened price moves.
High probability of regime shift post 2025
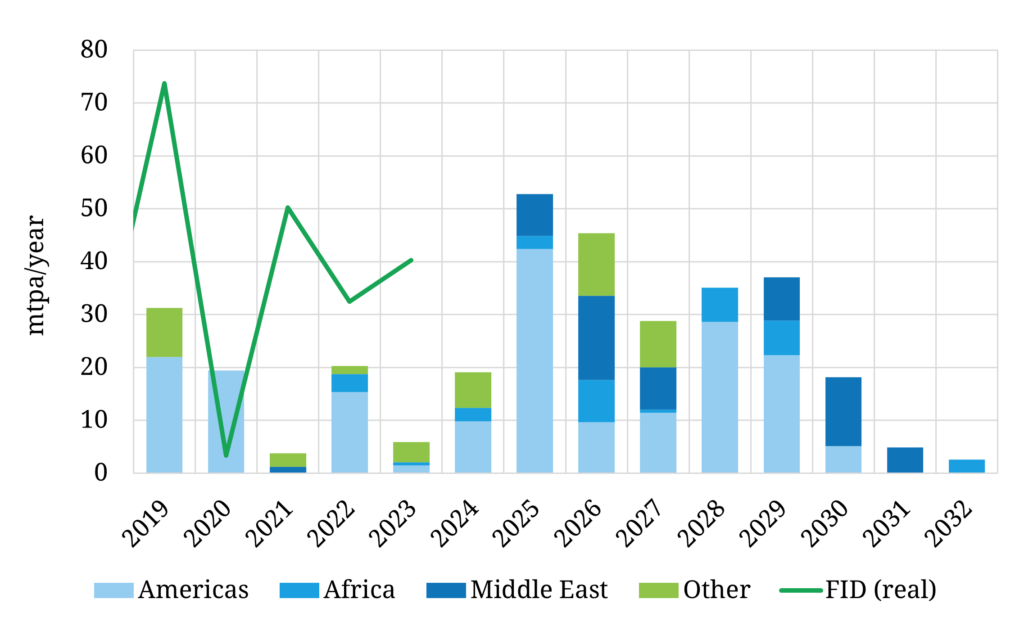
There is a strong influence of upstream LNG investment cycles on global market balance and prevailing market regime. Chart 3 shows why our modelling points to regime change post 2025. A large wave of new post FID supply is scheduled to come online from the second half of 2025.
Chart 3: Global post FID LNG supply volumes
It is this new supply that cause a quite significant change in JKM price elasticity in the 2026 (right hand) panel of Chart 2. Our modelling shows this new wave of supply acts to:
- Drive down the absolute level of global gas prices (& gas relative to crude)
- Increase the responsiveness (elasticity) of both supply & demand around the margin
- Dampen volatility versus recent very high levels (although still at structurally higher levels than pre-crisis)
- Materially increase the influence of US Henry Hub on global gas price signals.
This shift in pricing dynamics has major repercussions for LNG & gas portfolio value. For example structure of contract price indexation (e.g. HH vs TTF/JKM vs Brent), pricing of physical flexibility (e.g. cancellation options, UQT/DQT, shipping capacity) and timing of investment decisions.
If you are interested in more details, join us for our next webinar (see below).
Join our upcoming webinar
Title: ”‘A new lens” – how shifting pricing dynamics are set to drive LNG portfolio value
Date: Tues 17th Oct 09:00 BST (10:00 CET, 16:00 SGT)
Registration link here, free to attend
Focus:
- Market regime shift set up from 2024 into 2030s
- Marginal drivers of regional price spread evolution (e.g. HH vs TTF vs JKM)
- Evolution of price volatility & correlation + value impact
- Why crude vs gas pricing is set to be a big LNG portfolio value driver
- Brent SPA case study quantifying valuation breakdown